


Introduction
Genetic improvement in animals and plants for food consumption has been practised and realised since domestication. Intensive improvement, increasingly with incorporation of genetic principles, has been undertaken for a century or more. Much of this has been highly intensive and effective, notably in poultry. There are consequently concerns that genetic variation is being exhausted and continued gains cannot be expected. On the other hand, new technologies, in particular using molecular markers and, perhaps, transgenic methods, have become available, which in themselves provide the possibility of increasing responses by making better use of existing variability and indeed in generating new variability.In this paper I shall review the magnitude and rates of changes that have occurred in some of our domestic species, mainly in animals rather than plants, in view of my area of knowledge and the potential readership. I shall also consider what opportunities there are for continued change and what influence these, using data from experiments which provide pointers. First, however, I shall review the methods for estimating genetic change, their assumptions and their limitations. None of this is new. The methods available differ greatly among domesticated species as does the information we have about genetic change because of different investments made in its estimation.
Much of the material presented here was first collected for an article (Hill and Bünger, 2004) on long term genetic change in laboratory and domesticated animals to celebrate 100 years of selection in the Illinois maize experiment. I shall also make use of material on crop species presented in other papers collected in the same issue of Plant Breeding Reviews (Janick, 2004)). Another source of information is a collection of papers reviewing genetic change in livestock (Hill et al., 2000). Whilst I shall focus mainly on the production traits and indeed the substantial changes that have occurred, concern has been expressed (e.g. by Rauw et al., 1998) about the deleterious correlated effects of such selection, and I shall consider what has been and is being done to counteract these undesirable changes. Information on some of the genetic changes has also been reviewed previously by Havenstein (2006) in this journal. The present review is not intended to be comprehensive.
2. Measurement of genetic change
Estimation of genetic change requires comparisons of genotypes bred in different years in the same environment or corrected for environmental differences, and the problems of doing so had extensive discussion, particularly many years ago (e.g. Hill 1972). Simple comparisons of mean performance across generations are a reliable estimate of the genetic change only if the environment is really constant. This seems to be feasible for laboratory populations, such as Drosophila maintained at constant temperature with a defined single feed source, but only for traits such as bristle number which are highly heritable and seem not to be overly dependent on the management. It becomes less feasible even in the lab for traits such as litter size in mice, where even under the best managed regimes, health problems may arise. The nearest approach in livestock would be random sample tests or similar trials maintained over years in defined conditions, but even so the possibility of, for example, changing disease state and feed quality can not be unequivocally ruled out.Proper comparisons involve comparisons of different genetic groups, e.g. animals bred from parents of different generations maintained together in the same environment, i.e. a between-genotype, withinenvironment comparison. An important requirement is that there are no confounding effects if different generations are compared, for example due to age of parents. For species of plants propagated by seed, where seed storage under controlled conditions is reputed to have no effect on plant performance, such comparisons are straightforward (providing the material has been saved). For manylivestock species maternal age effects are hard to eliminate, but comparisons through the sire are feasible although these measure only the additive component of change. Modern methods of genetic evaluation using “best linear unbiased prediction” (BLUP) enable breeding values to be predicted for animals in all generations, and thus a trend over many years computed. These require an overlap of generations however, standard for dairy cattle, but connections become weak for programmes run with annual generations. Whilst, as the name suggests, BLUP methods are unbiased, they are so only if the parameters are known without error. Selection is incorporated using the selection differentials and heritability, so simple use of BLUP comparisons, particularly in populations where sire use is short, cannot be regarded as fully reliable. Thus while BLUP is an excellent procedure for making comparisons of breeding values of near contemporaries, BLUP estimates of genetic change over many generations have to be treated with more caution, as do repeat mating designs, for the errors accumulate unless deliberate efforts are made to ensure inclusion of new offspring of sires over very long periods and equal treatment of them.
A further complication of such inter-generation comparisons when the period of contemporaries spans only few years is that estimated responses can be confounded with genotype x environment interaction. For example, assume a disease organism mutates regularly such that different host resistant genotypes are resistant or new diseases arise, and that some genetic resistance is built up, but the disease is then controlled by non-genetic methods. Inter-generation comparisons may then reflect the results of increased performance through increased genetic resistance to the current strain of pathogen, but with no long term benefit in that comparisons each side of the rise and fall of the pathogen actually do not include it.
Whilst seed, semen and ova (of most species) can be stored indefinitely with no likely or measurable important change, it is not an option in all species. An important method is, therefore, maintenance of a population which is bred but aimed to be constant, i.e. a control population. One method is to use inbred lines which, once established, are stable apart from mutation and residual variation; but while they are available for mice, they are not for cattle. They also have a potential disadvantage in that the lines or their cross represent few surviving and thus selected genotypes, which may not respond similarly to environments as the modern stock. Control populations maintained segregating need to be kept with large effective size in order to minimise genetic drift. They are therefore expensive to maintain and become increasingly more expensive as they become less competitive compared to modern stock. Also, increasingly, they may respond differently to the modern environment than do current selected populations, but they do also offer the opportunity to make comparisons using different management regimes, e.g. former and modern diets. A further concern is that, particularly if the controls represent the best available in the year of foundation, their performance may have deteriorated genetically since foundation as a consequence of natural selection, and it is difficult to assess the magnitude of such a change. The issue of whether the selected stock improved or the control populations or repeat mating populations declined has been a major source of debate.
One question which is often asked is how much of the phenotypic improvement seen in commercial performance is attributable to genetic rather than environmental changes. Whilst a basic question, it is not necessarily relevant, because one can adapt to meet or utilise changes in the other. For example, modern varieties of cereals yield more than old varieties in large part because they can be given heavier fertiliser treatment without lodging as they have been bred to have shorter straw. The genotypes and environment co-evolve. Indeed to a breeder, the only comparison really relevant is how his stock compares with competitors under current or potential management systems. Even so, if we are to assess the achievements of breeders and the opportunities for further change, we need to make cross-generation comparisons.
Whilst it is easy to point to limitations of most or all of the methods, we have to be grateful that good ones are available, and thank those who enabled them by providing the foresight, persistence, and continued funding for maintenance of seed or semen banks or control populations or controlled trials. The results of their work illustrate the power of genetic change but also illustrate some problems. We first consider poultry, for which we have excellent data on the large genetic improvements that have been made.
3. Broiler poultry
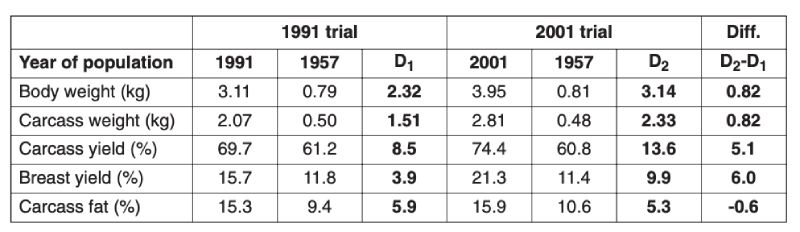
A control population, the Athens Canadian Random Bred Control population, was established in 1957 from crosses in 1955 of four broiler strains, three commercial and one experimental, since when it has been maintained without selection and apparent phenotypic trend. Based on comparisons with this control, a magnificent set of data on genetic improvement has been collected by Havenstein and colleagues in two trials, the first using 1991 commercial stock (Arbor Acres) and the second using 2001 stock (Ross 308). In each case the modern product was compared with the control using a modern diet and the one constructed to 1957 specifications. Havenstein (2006) illustrates the magnitude of change with photographs of broiler carcasses.Body weights of controls and a 2001 commercial broiler are summarized in Table 3.1. This table shows that the much greater growth rates after 44 years of improvement are seen on both diets and that the major part of the improvement, about 80%, could be attributed to genetic change. In Table 3.2 changes in other traits are also compared and spectacular changes in, for example, meat yield shown together with a reversal of the earlier increases in fat content. In this table the differences between 1957 and 1991 and between 1957 and 2001 birds are also compared, from which rates of change during the 1990s can be seen. It is notable that response was still continuing apace, i.e. of the order of over 2% of the mean per year in body weight. Even if the control population had declined in performance when selection was initially relaxed, such a change could not contribute to the 2001/1991 comparison.
Table 3.1 Comparison of body weights of males at different ages between 1957 and 2001
strains reared on diets to 1957 and 2001 specifications. (Source Havenstein et al.
2003a)
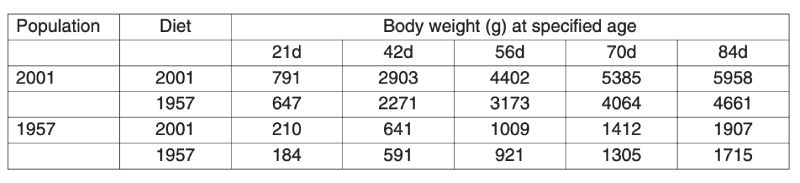
Table 3.2 Comparison of growth and body composition of 1957 control and 1991 commercial
and of 1957 control and 2001 commercial broilers reared on the diet used in that
year. The difference D1 denotes changes between 1957 and 1991 and D2 between
1957 and 2001, and D2 – D1 the estimated change between 1991 and 2001. (Sources:
Havenstein et al., 1994, 2003a,b)
A major concern has been whether improved growth performance has been at the expense of reduced fitness, in particular leg strength and viability. In the 2001 study of Havenstein et al. mortality rates were much lower than in the 1991 strain, both in the control and selected populations. In the later study, cumulative mortality (averaged over diets) for, respectively, the 2001 selected and 1957 control to 42 days was 3.6% and 2.1%, and at 56 days, 6.8% and 4.0%, indicating somewhat higher mortality in the modern strain (Havenstein et al., 2003a). At the same live weight, however, mortality was lower in the selected population. Leg abnormalities were not recorded in this trial, but selection pressure has been applied to reduce leg abnormalities by breeders, and this seems to have produced results. Changes can be estimated using industry comparisons of modern (M) lines with the lines from which they were derived maintained as unselected controls (C) since 1972. Results obtained by Aviagen were as follows, averaged over differences between three control (1972) and three modern (2005) lines selected from them: Live weight at 42 days, M 2595g C 1216g; Feed conversion ratio to 2kg live weight M 1.66, C 2.23; Mortality to 42 days M 4.2%, C 3.9%; and proportion of birds with good leg health (GLH) M 75%, C 68% (Fleming et al. 2007). Thus, despite the much superior growth rate and feed efficiency, average mortality and leg strength are similar in the selected lines to those of the controls (differing somewhat among lines, not shown). McKay et al. (2000) also show that the leg traits had been worsening, but then were improved by subsequently devoting selection effort to this fitness trait.
Turkeys Havenstein and colleagues (2007) have conducted a similar study to theirs with broilers in which turkeys from a 1966 control strain and 2003 commercials were compared on each of the diets typical for 1996 and 2003. Changes found were large indeed. For example, the number of days required to reach 11kg was approximately halved, and the corresponding feed conversion efficiency also halved (modern: fcr 2.13 at 98 days of age; control: 4.21 at 196d). Mortality rates were non-significantly higher in the controls.
4. Table egg poultry
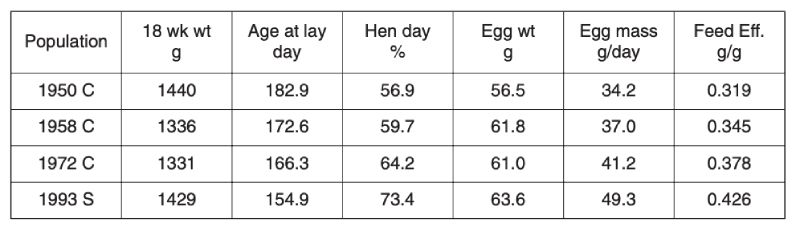
Selection limits in egg laying poultry were first mooted over 50 years ago by Dickerson (1955), in part because gains in nucleus flocks were not being realised in commercial practice. Fortunately it seems that such pessimism was unfounded, as data both from comparisons using unselected control populations and stock evaluations show. Comparisons between unselected control lines derived from commercial stock over three periods from 1950 with the performance of a selected population of 1993 are shown in Table 4.1 (Jones et al., 2001). All measures of performance, namely age at first egg, egg production and egg weight, have improved, while body weight has remained relatively unchanged. Consequently there has been an approximately 30% improvement in feed conversion efficiency over the 40 year period from 1950, which was continuing after 1970. Even if selected lines had regressed in performance, this is unlikely to have affected comparisons between the control populations, all long relaxed before 1993.Table 4.1 Progress in egg production: Contemporary comparison of egg production traits
for unselected control lines (C) established from selected populations in 1950, 1958
and 1973, with a commercial population (S) of 1993. (Source Jones et al., 2001)
Another source of information comes from German Random Sample Tests (Flock and Heil, 2002). In these tests, the environment was intended to be as constant as practical, but close to commercial conditions in terms of disease prevention and feed quality. Phenotypic changes over years should therefore mainly reflect genetic changes, but there can be no hard evidence that this is the case. Changes in mean performance over a 24 year period (1975-1999) are shown in Figures 4.1 and 4.2 for egg mass per hen housed and feed conversion ratio, the two economically most important traits. Individual points for 6 strains with the same shell colour.
Figure 4.1 Phenotypic trend for total kg egg mass per hen housed in German Random Sample
Tests (Source: Flock and Heil 2002)
Figure 4.2 Phenotypic trend for feed conversion ratio (kg feed/ kg egg mass) in German Random
Sample Tests (Source: Flock and Heil 2002)
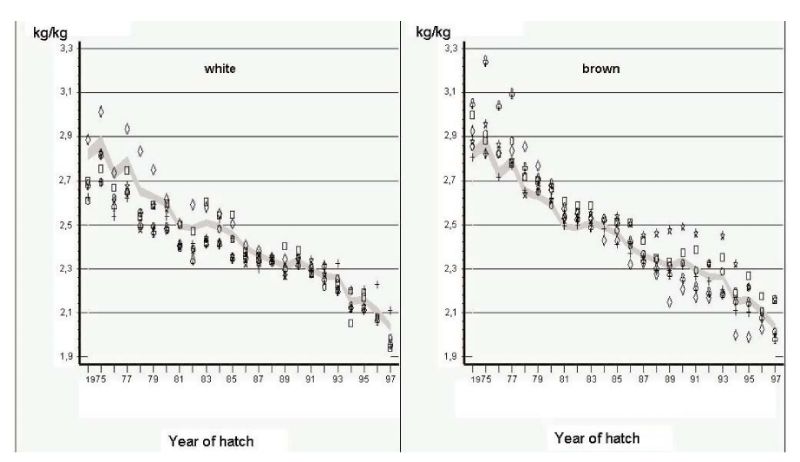
Least squares annual means are shown for 6 white-egg and 6 brown-egg strains as deviations from a 95% confidence interval for all strains. Changes have been large indeed, mainly in persistency of rate of lay, with reduction in age at first egg mainly during the first years of the period covered. Body mass at end of lay (500 days) was reduced more in brown egg strains, which contributed to improvements in feed conversion efficiency and egg income over feed costs.
As egg production itself is a fitness associated trait, there is less potential concern about declines than there may be with traits of the growing animal such as growth rate and leanness. Annual changes varied between the five stations included in the analysis, and the general trend of reduced laying mortality was reversed when beak treatments were discontinued (Flock and Heil, 2002).
5. Dairy cattle
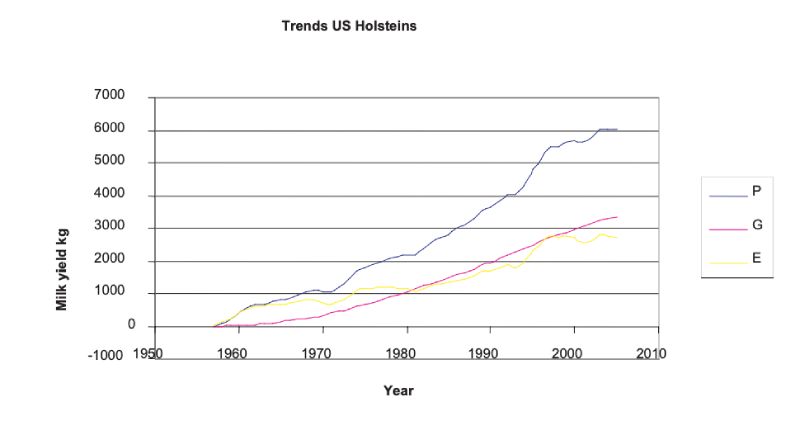
With the advent of progeny testing and increasingly sophisticated methods of breeding value prediction leading to animal model BLUP, rapid improvements in production traits have been effected. The clearest source is from trends in BLUP estimates over years, which although somewhat model dependent in the sense of depending on assumptions of parameter values and on how selection has been practised, are less so over time periods where sires of different years of birth have progeny spanning many overlapping years. Figure 5.1 shows these for US Holsteins, where the accelerating and continuous trend is shown. It is seen that approximately half the doubling in yield from about 6000kg to 12000kg over an almost 50 year period can be attributed to genetic change. There have been changes of similar relative magnitude in yields of fat and protein.Figure 5.1 Phenotypic mean yields (P), mean breeding values (A) and environmental effects
(E = A – P) for US Holsteins, derived from USDA data; mean yield in 1957 was 5859 kg.
(http://aipl.arsusda.gov/eval/summary/trend.cfm)
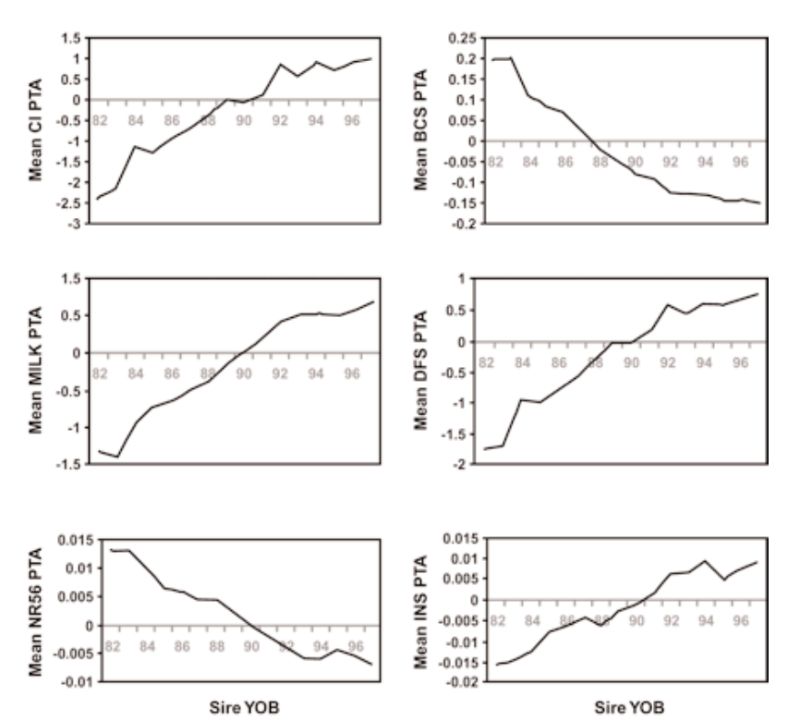
There have, however, been substantial changes in fitness associated traits as a consequence, with estimates of reduction in fertility of the order of 1% per year. Examples of genetic trends in the UK in a number of traits are given in Figure 5.2. These show a strong positive trend in milk yield (as for the US data, not least a consequence of international movement of genes). This is accompanied by increasingly leaner animals (reduced condition score, a concern as animals lose weight in early lactation and may not be fertile till they start gaining again), and reductions in a number of measures of fertility (days to first service after calving, non-return rate to oestrus after insemination, number of inseminations per conception, and calving interval).
Figure 5.2 Genetic trends in production and health traits in the UK, expressed as transmitting
abilities (PTA), for: calving interval (CI), condition score (BCS), milk yield in kg at
day 110 (Milk), days to first service (DFS), non-return rate 56 days after service
(NR56), and number of inseminations per conception (INS). (Source: Wall et al.,
2003)
Largely as a consequence of these unfavourable changes in fitness associated traits, there has been a major shift in emphasis in programmes which had been mainly aimed just at production traits. Although such traits are more lowly heritable and often harder to record (e.g. indicators of lifespan), there is evidence of genetic variation and thus opportunities for improvement. The changes in milk yield (Fig 5.1) show accelerating rates until the 1990s, and it is likely that there has been some subsequent reduction in rates of improvement in production traits as more emphasis has been given to fertility and health traits.
6. Pigs
As with poultry, very great genetic change has been effected in pigs. Early organised selection programmes were through progeny testing, notably in Denmark, but subsequently there has been increased emphasis on performance testing for traits of growth and carcase, particularly with the advent of ultra-sonic fat depth scanning. More recently, there has been increased emphasis on reproductive traits, as better analysis methods became available and opportunities for further reduction in fatness diminished.Long term changes can be illustrated only through phenotypic change, as there were neither control populations nor sophisticated BLUP evaluation. One source is mean performance in central tests in the Netherlands (Merks, 2000), shown in Table 6.1. This shows halving of fat depths over a 60 year period from 1930, much of it prior to introduction of modern breeding programmes. It is uncertain how much of this is due to change in management; for example simple feed restriction is effective in reducing fatness.
Table 6.1 Phenotypic trends for pigs in central test stations in the Netherlands in daily gain
(DLG), feed conversion ratio (FCR) and backfat thickness (Fat). (Source: Merks,
2000).
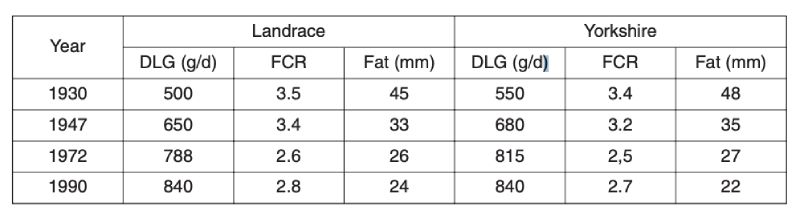
Figure 6.1 Genetic changes in four breeds of pigs in registered herds in the USA in growth
traits and litter size (Source: Chen et al., 2002, 2003)
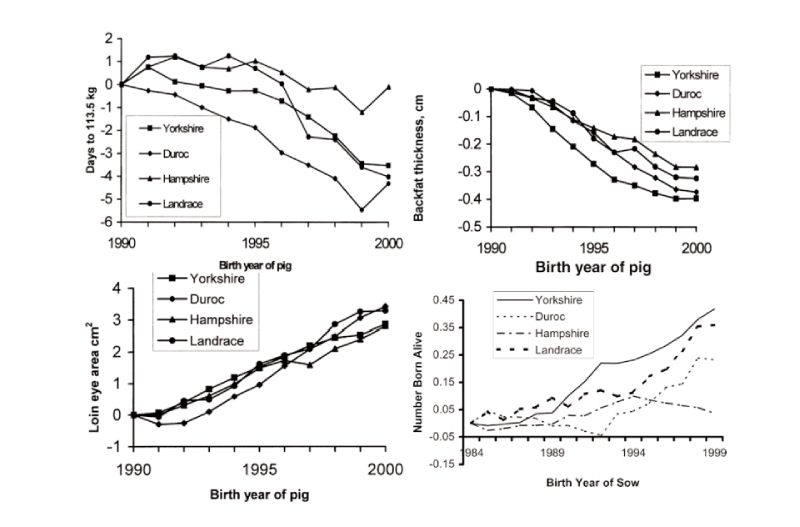
Published estimates of genetic change free of changes in management are available from BLUP analyses, with a nice set of results obtained for the 15 year period to 2000 for registered herds in the USA (Chen et al., 2002). These show substantial favourable changes in growth rate, lean growth rate, backfat and loin eye area; for example days to 113 kg live weight were reduced by 0.4 days/year on average (Figure 6.2). During this period, more so in later years, reproductive performance has also been improved, particularly in the Yorkshire breed which is used mainly as a dam line (a yearly trend averaging 0.03 pigs born alive), but with little change in the Hampshire, used primarily as a sire line. These figures do not relate directly to the performance of commercial crosses, as given previously for broilers, and so possibly underestimate the total changes. They may also be subject to sampling errors and bias through rapid turnover of sires and multi-trait selection. Even so, there has clearly been major and continuing improvement in pig performance. Increasingly emphasis is being given to health and welfare related issues, such as removing sow restraints and thus, for example, on other traits associated with piglet survival.
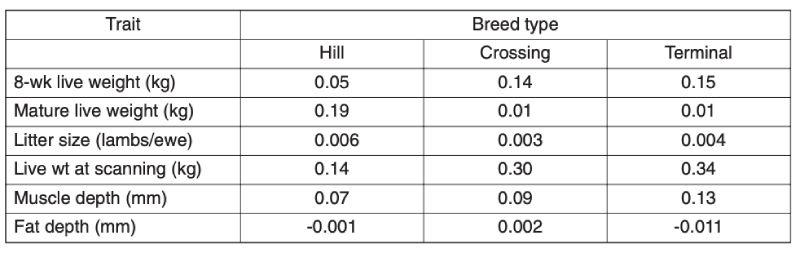
7. Beef cattle and sheep
As the main aim of this review is to assess long term improvement and these are likely to be greater in the intensive industries, only limited information is provided here on the grazing species. Recent analyses provide evidence of substantial improvement within breeds in the UK in the last decade (Amer et al., 2007). Results for sheep are given in Table 7.1; but they span a relatively short time (approx. 6 years) and sires are used for only a limited number of years, so estimates of change are not precise. These estimated trends using BLUP show for different types of breeds of increased growth rate and increased muscle depth, with inconsistent and small changes in fatness and litter size.Table 7.1 Annual genetic trends in traits of sheep in the UK, averaged over breed types, for
the period from 2000 (Source: Amer et al., 2007)
For beef cattle in the UK, over both the periods 1991-5 and 1999-2003, there were substantial annual increases in beef value, a function of weight and carcase merit, in terminal sire and dual purpose breeds, similar for the two: averaging £0.43/yr in the first period and £0.69/yr in the second (Amer et al., 2007). There were also, however, worsening figures for calving ease, with percent unassisted falling by 0.34%/yr in the terminal breeds and 0.11%/yr in dual purpose breeds, similar over the two periods. These changes presumably reflect direct and correlated consequences of selection for growth.
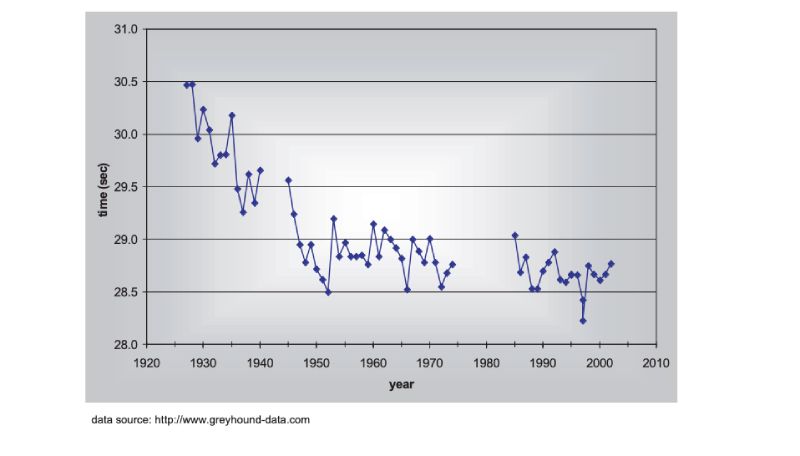
8. Racehorses and Greyhound Dogs
There are no long term estimates of genetic trend for racing animals, but their long history of selection merits their consideration here, as do the results. As a proxy, the winning times for Thoroughbred horses in the Kentucky Derby in the US are shown in Figure 8.1, spanning almost a century (for details, see Hill and Bünger, 2004). What is striking is that there has been little obvious change since about 1950, despite the enormous emphasis given to breeding, and the record for the race stands from 1973. A similar pattern holds for greyhound dogs (Figure 8.2). These are simple phenotypic estimates, but there is no need to argue that some of the response has been genetic! For trotters there is, however, evidence of continuing genetic change over the 20 year period from 1976 (Arnason, 2001), with a total reduction of about 5% in time over a fixed distance.Figure 8.1 Changes in Thoroughbred horses: winning times in the Kentucky Derby. (Source:
Hill and Bünger, 2004)
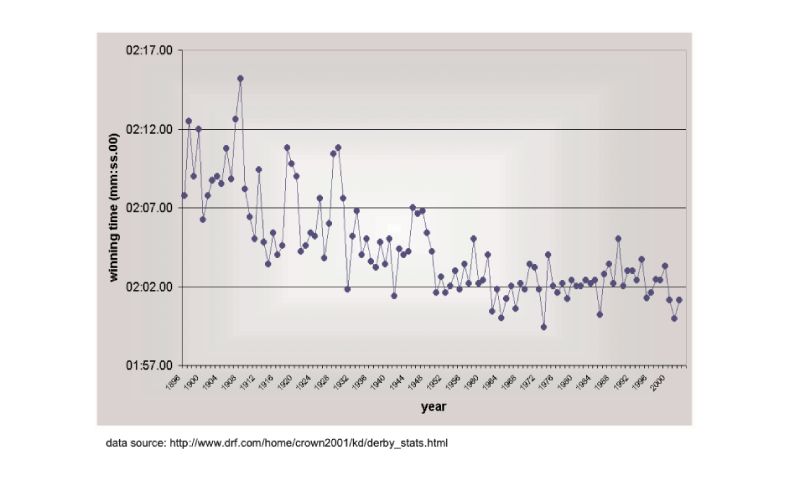
Figure 8.2 Changes in Greyhound dogs: winning times in the English Greyhound Derby (480m
except 500m 1975-84, run at a different location in London after 1984). (Source: Hill
and Bünger, 2004)
There has been quite extensive analysis of pedigree data in Thoroughbreds to estimate genetic parameters, and Gaffney and Cunningham (1988) and later others have reported values of almost 50% for Timeform ratings (relative performance measure used for handicapping) and winnings. Based on such analyses and using BLUP, Gaffney and Cunningham predicted there has been substantial genetic change, albeit while observing the lack of phenotypic change. They also note high selection intensities on performance, albeit rather long generation intervals. There are of course potential biases in heritability estimates, for example environmental covariance of sons and sires due to choice of trainer for offspring of the most successful stallions. Even so, there is recent evidence of no relationship between stud fee and earnings of offspring, surprising even in the absence of any genetic variation (Wilson and Rambault, 2007). Racehorse and Greyhound breeders have a different business model from those breeding and improving food animals.
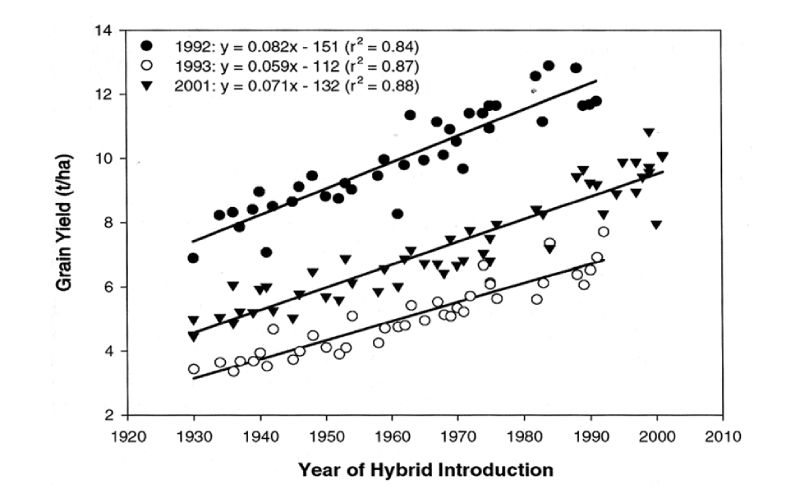
9. Maize
We are familiar with the enormous changes in yields of crop plants over the years, and shall not review these in detail. As results of a maize selection experiment are discussed in the next section and it is one of our major feed crops, here data on maize improvement are included for illustration. Duvick et al. (2004) gave results for trials in which maize varieties introduced in different years were grown from stored seed in trials conducted in the Midwest of the USA in three different years. The regression of yield on year of introduction provides an estimate of genetic trend (Figure 9.1). This is seen to be almost linear over a long period, with increases in excess of 1% of the mean per year. Furthermore, although there are big differences between the years in growing conditions as shown by the large differences between them in average yields, there appears to be little substantial evidence of genotype X environment interaction in that differences between hybrid cohorts were similar within each of the environments.Figure 9.1 Grain yield per hybrid maize variety in each of three trials in the US regressed on year
of hybrid introduction. (Source: Duvick et al., 2004)
10. Results of long term selection experiments
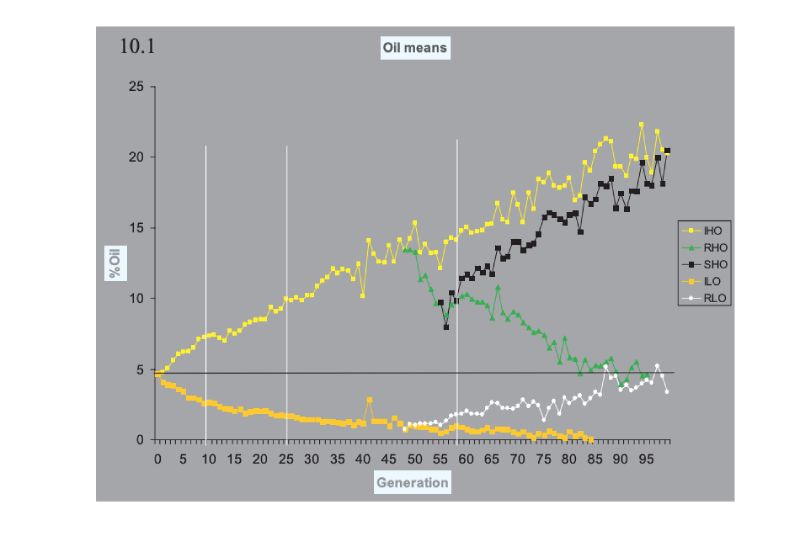
Turning now to consider prospects for future improvement, pointers can be obtained from the outcome of some selection experiments that have been run for very long time frames. These span 100 generations or so, are bred mainly in closed populations, and are thus of duration as long as or longer than our intensive breeding programmes. Many experiments of shorter duration have been conducted, in addition to others of longer duration in Drosophila, in which large responses have been obtained, but we use the following as pointers.The classic experiment is that of the Illinois corn (maize) experiment, which has now exceeded 100 annual generations of selection in separate lines high and low for oil and for protein percentage in the kernel. Results for oil content are shown in Figure 10.1, which shows results for continued selection and for lines in which the direction of selection was reversed. A plateau at essentially 0% oil has been reached in the low line, but the up line continues to respond. The pattern is similar in the protein lines (not shown), but the plateau in the low line is at ca. 5% protein, presumably near a minimum for a viable seed. What is striking is the continued, near linear, response upwards, and the fact that the reversed selection after 48 generations was so effective, illustrating the large amounts of variation still present then. The lines were maintained with typically only 30 plants selected per generation, although with different numbers at different times during the course of the experiment.
Figure 10.1 Results of 100 generations of selection in Illinois for high (H) and low (L) oil
content in the maize kernel. In lines RHO and LHO the direction of selection was
reversed, and in SHO it was reversed again. (Source: Dudley and Lambert, 2004)
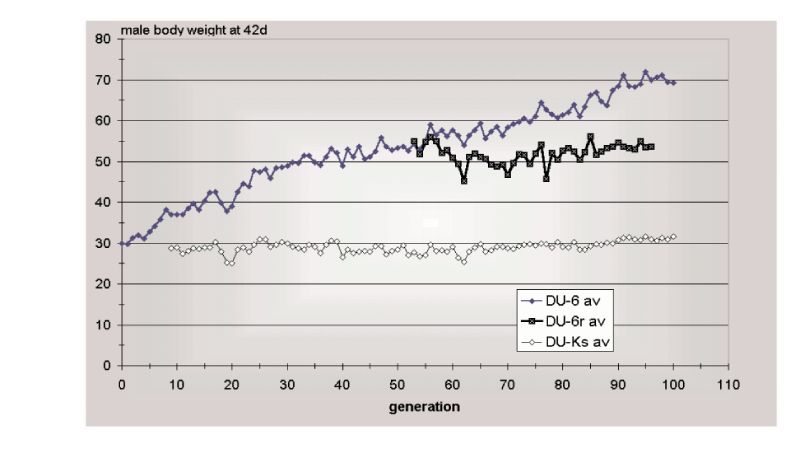
The second example is that of Marks’ selection lines for body weight from a wide genetic base of Japanese quail reared on one of two diets. Response continued in both lines for 97 generations (Figure 10.2), almost linearly after the first 20 or so generations. The third example is the Dummerstorf high growth selected line, in which response has continued for 100 generations (Figure 10.3) with an effective population size of about 60. Whilst there were some indications of curvilinearity, pointing towards a plateaux of response, plateaux had not actually occurred in this time.
Figure 10.2 Results of almost 100 generations of selection for increased 4 week body weight
in Japanese quail on two different diets (P, T), with contemporary unselected
controls (PC, TC). (Source: Marks, 1996)
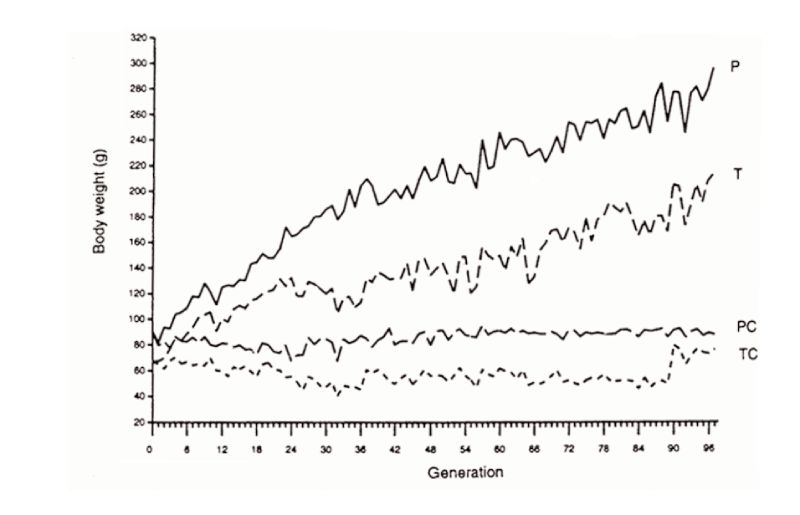
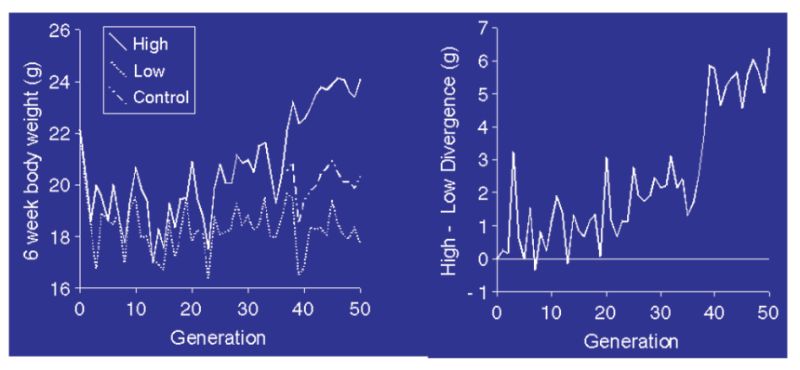
Figure 10.3 Results of 100 generations of selection (Du-6) for 42 day body weight of male
mice, together with an unselected control (Du-Ks) and a relaxed selection line
(Du-r). (Source: Renne et al., 2003)
These three experiments have been aimed at changing what are essentially growth or conformation traits. A 122 generation selection experiment has been conducted for litter size in mice (Holt et al., 2005), a trait with relatively low heritability and subject to more inbreeding depression. The high selected line was not closed, however, as selected lines were brought in from elsewhere. From an initial mean of about 10 animals born alive per litter, also approximately the mean of an unselected control population at the end, the mean of the selected line increased to about 20 and was still showing some response in the last 20 generations. A doubling of reproductive rate is not spectacular; nor is it trivial.
The laboratory selection experiments were conducted with much less intense selection that commercial breeders can achieve, but typically with smaller population sizes, and (except for litter size in mice) the populations were closed after their foundation. In some cases (for example in the Dummerstorf lines) when selection was relaxed, there was a regression in response, a feature seen much strongly in some experiments in Drosophila. Thus Yoo (1980) selected for abdominal bristle number in Drosophila for 80 generations, and while continued response was achieved, relaxation led to a big drop in response associated with genes having a positive effect on bristle number but a negative effect on fitness that were still segregating.
Very substantial changes have, of course, been observed in selection experiments run for fewer generations. Notably, Siegel conducted selection high and low for 8 week body weight in broilers, and the resultant lines diverged 8-fold in body weight after 37 generations (Liu et al., 1994). In the low lines, some birds show anorexia.
11. Prospects for continued improvement
Modern developments, such as the introduction of molecular genetic methods, should have an important impact on rates of genetic progress, particularly for traits that are difficult to record on live animals (e.g. meat quality), sex limited (e.g. egg number) or lowly heritability (e.g. mortality). Whilst much emphasis so far has been on identifying QTL affecting production traits, and there have been a few successes (e.g. DGAT in dairy cows), the impact has not yet been great. The alternative scenario of utilising high density mapping of the whole genome to identify regions of genomic effect and of similarity of relatives, ‘genomic selection’ (Meuwissen et al., 2001), seems to offer more opportunities and is now being introduced. I shall not review these but address the more long term questions: What are opportunities for long term improvement? What is likely to influence them?An important concern is whether there has been a substantial loss in variability in the commercial populations. There is little evidence that is the case. One source of information is from estimates of genetic variation in quantitative traits within lines. In analyses of Ross lines by Koerhuis and Thompson (1997) estimates were 25% and 32% in two lines. These figures are similar to or higher than the ‘traditional’ estimate of 25% heritability of growth rate, e.g. in the early generations of Siegel’s experiment (Liu et al., 1994), albeit the modern estimates were based on more sophisticated statistical procedures. For egg production, Preisinger and Flock (2000) quote estimates of heritability of over 30% in the early phase of the laying period, 10% at peak lay (when most birds lay most days), and 20% in the mid-late period, values which would not seem out of line with historical estimates.
For dairy cattle, where the estimate of heritability used in the 1950s was about 25%, it is now 35% or more. Of course modern methods of analysis eliminating environmental and selection effects, better records and control of the environment enhance these later figures, but they do not indicate genetic variance is lacking.
A second kind of information comes from observations on variation at molecular markers in populations which are presumably do not influence the production traits and are indicators of neutral variability. A nice set of data collected on poultry has been provided by the International Chicken Polymorphism Map Consortium (2004), who compared SNP diversity within and between Jungle Fowl and modern broiler and egg laying stocks (Table 11.1).
Table 11.1 Estimation of molecular genetic diversity in chickens expressed as frequency of
single nucleotide polymorphisms (SNPs) within and between populations.
(Source: International Chicken Polymorphism Map Consortium, 2004)
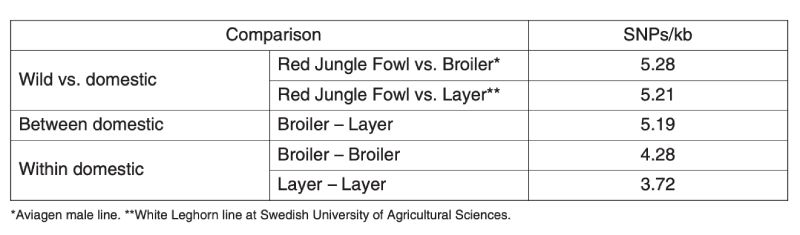
There is less variation within the egg layer stocks than within the broiler stocks, presumably because the former are typically maintained with lower effective population sizes as the primary selection trait is sex limited and accurate selection requires more emphasis on relatives’ information. Although both broiler and layer lines are less variable than is the Jungle Fowl, they retain about 70% and 80% respectively of the molecular variation.
Calculations show that the long term selected experimental populations (see Section 10) would have lost much of their initial variation as a consequence of genetic drift (inbreeding) through finite population size, even if no selection had been practised to speed up fixation of favourable genes. It follows that the continued response must increasingly derive from new mutations that have arisen since intensive selection started (Hill, 1982). Selection experiments have been undertaken with selection starting from totally inbred populations, such that any response must have come from mutations that occurred since selection started. An example is given in Figure 11.1 (from Keightley, 1998).
Figure 11.1 Response to selection for 6 week body weight in a highly inbred line of mice. The
left panel shows high, control, and low line means; the right panel shows the
divergence. (Source: Keightley, 1998)
The responses are small compared with those seen from outbred base populations (e.g. Fig 10.3), but even so the divergence reached about 20% of the mean after 50 generations in a very small experiment. Evidence from this and other experiments suggest this is of the order of 0.1% new heritability per generation, seemingly a small figure but it arises each generation and thus accumulates. Such a level of mutational heritability would also be sufficient to explain much of the continued responses seen in these lab/field experiments. Whilst direct evidence is lacking, it therefore seems reasonable to argue that mutation is the source of variation which is fuelling the continued responses seen in the production traits and also help to explain why heritabilities are not falling for say milk yield and poultry body weight or egg number. There is therefore no reason to expect responses to cease as variation will not run out.
Recurrent mutation is not the only possible explanation for continued responses. A hypothesis currently in vogue is that these are consequent on the release of new variation hidden in epistatic combinations (Carlborg et al., 2006), using evidence of epistasis in crosses made between high and low lines of Siegel’s high and low weight selected broiler lines (Liu et al., 1994). Such epistatic effects cannot, however, explain the results of experiments started from an inbred base (e.g. Fig 11.1).
The rate of loss of existing variation in a closed population is proportional to 1/Ne and the magnitude of variance maintained by mutation proportional to Ne, where Ne is the effective population size. Thus population size plays a crucial role in long term gains, so the simple message is to keep it high, a theoretical prediction supported by laboratory selection experiments (see e.g. papers in Jannick, 2004). Sophisticated methods have now been developed to maximise response at fixed rates of inbreeding (i.e. specified Ne), taking account both of optimum use of each potential parent and relationships among them (e.g. Villanueva et al., 2006). When we consider the impact of molecular methods, we also have to consider the impact on Ne. Simple concentration on one single QTL is likely to reduce Ne. It is possible that genomic selection, in which emphasis is spread across the genome, with an increased emphasis on individual genotype rather than family performance, will enable Ne to be increased.
Thus we can be very positive about continued responses. But what about the horses and dogs – why don’t they run faster? I do not know, and can only speculate, but will do so briefly. A) One argument is that little selection is practised, but successful horses on the track are prized as sires and get the best mates. B) Another is that the thoroughbreds have a very narrow base population and thus lack variation. But mutation subsequent to its foundation over two centuries ago should have generated new variation, as for other traits in other species. C) There may be a ‘physiological limit’ for speed. But other animals can run faster (e.g. cheetah), and in any case it is genes which determine the physiology and genetic change could affect such a limit (within constraints of metabolic biochemistry). D) Mutations do occur, but all are deleterious with respect to speed. This is my favourite explanation, but is also weak. In a sense it implies a physiological limit – nothing can be better. But if there is also strong selection on confirmation, then odd looking horses would get rejected before they had a chance to run. We can speculate indefinitely.
Even if we do not understand all the results, particularly those for the horses and dogs, it is clear from what has been presented that breeders have been highly effective in producing very large genetic changes over very long periods, and that there is reason to expect continued rapid change.
Amer, P.R., G.J. Nieuwhof, G.E. Pollott, T. Roughsedge, J.Conington, and G. Simm 2007. Industry benefits from recent genetic progress in sheep and beef populations. Animal 1: 1414-1426.
Arnason, T. 2001. Trends and asymptotic limits for racing speed in standardbred trotters. Livest. Prod. Sci. 72: 135-145.
Carlborg, Ö., L. Jacobssen, P. Åhgren, P. Siegel, and L. Anderson, L. 2006. Epistasis and the release of genetic variation during selection. Nature Genet. 38: 418-420.
Chen, P., T. J. Baas, J. W. Mabry, J. C. M. Dekkers and K. J. Koehler. 2002. Genetic parameters and trends for lean growth rate and its components in U.S. Yorkshire, Duroc, Hampshire, and Landrace pigs. J. Anim. Sci. 80:2062-2070
Chen, P., T. J. Baas, J. W. Mabry, K. J. Koehler and J. C. M. Dekkers. 2003. Genetic parameters and trends for litter traits in U.S. Yorkshire, Duroc, Hampshire, and Landrace pigs. J. Anim. Sci. 81:46-53
Dickerson, G.E. 1955. Genetic slippage in response to selection for multiple objectives. In: Cold Spring Harbor Symposia on Quantitative Biology 20: 213-224.
Dudley, J.W. and R.J. Lambert, 2004. 100 generations of selection for oil and protein content in corn. Plant Breed. Rev. 24: part 1, 79-110.
Duvick, D.N., J.S.C. Smith and M. Cooper. 2004. Long-term selection in a commercial hybrid maize breeding program. Plant Breed. Rev. 24: part 2, 109-151.
Fleming, E.C., C. Fisher and J. McAdam. 2007. Genetic progress in broiler traits – implications for welfare. Proc. Brit. Soc. Anim. Sci. 2007, p. 50.
Flock, D.K. and G. Heil. 2002. A long term analysis of time trends in the performance profile of white-egg and brown-egg hybrid laying strains based on results of official German random sample tests from 1974/5 to 1997/9. Arch. Geflügelk. 66: 1- 20.
Gaffney, B. and E.P. Cunningham. 1988. Estimation of genetic trend in racing performance of thoroughbred horses. Nature 332: 772-724.
Havenstein, G.B. 2006. Performance changes in poultry and livestock following 50 years of selection. Lohmann Information 41: 30-37.
Havenstein, G.B., P.R. Ferket, J.L. Grimes, M.A. Qureshi and Nestor, K.E. 2007. Comparison of the performance of 1966- versus 2003-type turkeys when fed representative 1966 and 2003 turkey diets: Growth rate, livability, and feed conversion. Poult. Sci. 86: 232-240.
Havenstein, G.B., P.R. Ferket and M.A. Qureshi, 2003a. Growth, liveability, and feed conversion of 1957 versus 2001 broilers when fed representative 1957 and 2001 broiler diets. Poult. Sci. 82:1500-1508.
Havenstein, G.B., P.R. Ferket and M.A. Qureshi. 2003b. Carcass composition and yield of 1957 versus 2001 broilers when fed representative 1957 and 2001 broiler diets. Poult. Sci. 82: 1509-1518.
Young, V.R. (2001): Progress in establishing requirements for amino acids in healthy adults and in disease states. Ann. Nutr. Metab. 45, 200 (Abst.)Havenstein, G.B., P.R. Ferket, S.E. Scheideler and B.T. Larson. 1994. Growth, liveability, and feed conversion of 1957 vs. 1991 broilers when fed typical 1957 and 1991 broiler diets. Poult. Sci. 73: 1785-1794.
Hill, W.G. l972. Estimation of genetic change. I. General theory and design of control populations. Anim. Breed. Abstr. 40: l-l5.
Hill, W.G. l982. Predictions of response to artificial selection from new mutations. Genet. Res. 40: 255-278.
Hill, W.G., S.C. Bishop, B.J. McGuirk, J.C. McKay, G. Simm and A.J. Webb (eds.). 2000. The challenge of genetic change in animal production. Occas. Publ. 27, British Society of Animal Science. (http://www.bsas.org.uk/)
Hill, W.G. and L. Bünger. 2004. Inferences on the genetics of quantitative traits from long-term selection in laboratory and farm animals. Plant Breed. Rev. 24: part 2, 169-210.
Holt, M., T. Meuwissen and O. Vangen. 2005. Long-term responses, changes in genetic variances and inbreeding depression from 122 generations of selection on increased litter size in mice. J. Anim. Breed. Genet. 122: 199-209.
International Chicken Polymorphism Map Consortium. 2004. A genetic variation map for chicken with 2.8 million singlenucleotide polymorphisms. Nature 432: 717-722.
Janick, J. (ed.) 2004. Long term selection. Part 1: Maize. Part 2: Crops, Animals and Bacteria. Plant Breed Rev. 24 part 1, 1-253; 24 part 2, 1-290.
Jones, D.R., K.E. Anderson and G.S. Davis. 2001. The effects of genetic selection on production parameters of single comb White Leghorn hens. Poult. Sci. 80: 1139-1143.
Keightley, P.D. 1998. Genetic basis of response to 50 generations of selection on body weight in inbred mice. Genetics 148: 1931-1939.
Koerhuis, A.N.M. and R. Thompson. 1997. Models to estimate maternal effects for juvenile body weight in broiler chickens. Genet. Sel. Evol. 29: 225-249.
Liu, G., E.A. Dunnington and P.B. Siegel. 1994. Responses to long-term divergent selection for eight-week body weight in chickens. Poult. Sci. 73: 1642-1650.
Marks, H.L. 1996. Long-term selection for body weight in Japanese quail under different environments. Poult. Sci. 75:1198- 1203.
McKay, J.C., N.F. Barton, A.N.M. Koerhuis and J. McAdam. 2000. The challenge of genetic change in the broiler chicken. In The Challenge of Genetic Change in Animal Production. (W.G. Hill et al., eds.) Occ. Publ. Brit. Soc. Anim. Sci. 27: 1- 7.
Merks, J.W.M. 2000. One century of genetic changes in pigs and future needs. In: Hill et al. (eds.) Occ. Publ. Brit. Soc. Anim. Sci. 27: 8-19.
Meuwissen T.H.E., B.J. Hayes and M.E. Goddard. 2001. Prediction of total genetic value using genome wide dense marker maps. Genetics 157: 1819-1829.
Preisinger, R. and D.K. Flock. 2000. Genetic changes in layer breeding: Historic trends and future prospects. In: Hill et al., (eds.) Occ. Publ. Brit. Soc. Anim. Sci. no. 27, 20-28.
Rauw, W.M., E. Kanis, E.N. Noordhuizen-Stassen and F.J. Grommers. 1998. Undesirable side effects of selection for high performance efficiency in farm animals: a review. Livest. Prod. Sci. 56: 15-33.
Renne, U., M. Langhammer, E. Wytrwat, G. Dietl and L. Bünger. 2003. Genetic-statistical analysis of growth in selected and unselected mouse lines. J. Expt. Anim. Sci. 42: 218-232.
Villanueva, B., S. Avendaño and J.A. Woolliams. 2006. Prediction of genetic gain from quadratic optimization with constrained rates of inbreeding. Genet. Sel. Evol. 38: 127-146.
Wall, E., S. Brotherstone, J.A. Woolliams, G. Banos and M.P. Coffee. 2003. Genetic evaluation of fertility using direct and correlated traits. J. Dairy Sci. 86: 4093-4102.
Wilson, A.J. and A. Rambault. 2007. Breeding racehorses: what price good genes? Biol. Lett. doi:10.1098/rsbl.2007.0588.
Yoo, B.H. 1980. Long-term selection for quantitative characters in large replicate populations of Drosophila melanogaster. II. Lethals and visible mutants with large effects. Genet. Res. 35: 19-31.
Zusammenfassung
Langfristige Zuchtfortschritte bei Nutztieren und Mais: Schätzmethoden, Ergebnisse und AussichtenNach einem Überblick über methodische Fragen der Trennung genetischer und nicht-genetischer Veränderungen werden Beispiele von verschiedenen Nutztierpopulationen (Broiler, Legehennen, Milch- und Fleischrinder, Schweine und Schafe), Sportpferden und -hunden, Labortieren und Mais aufgrund der Literatur dargestellt und diskutiert.
Bei allen Nutztierarten und Mais konnten deutliche Leistungssteigerungen belegt werden, mögliche Ursachen stagnierender Rennleistungen bei Pferden und Windhunden werden aus genetischer Sicht diskutiert. Selektionsversuche mit Labortieren unter gleichen Umweltbedingungen über viele Generationen stützen die Prognose, dass bei Nutztieren und Nutzpflanzen auf absehbare Zeit kein Ende des Fortschritts wegen abnehmender genetischer Varianz zu befürchten ist