


Summary
Hatchability is of considerable economic importance for all hatcheries and therefore must be given
appropriate attention in breeding programs for commercial layers. The variability between and within
strains will tell us whether reproductive performance can be improved by selection within specific
lines. The aim of this study was to analyse the genetic variation of hatchability and correlations with
production traits. Data collected from two pure-bred female lines (LSL) at 45-46 weeks of age were
used. Estimated heritabilities were low (h² = 0.13 and 0.15) for fertility, but moderately high (h² = 0.27
and 0.30) for hatch of ‘fertile’ eggs (eggs transferred at 18 days). Hatchability was negatively correlated
with egg weight (rg = -0.43 to -0.52) and albumen height (rg = -0.25 to -0.42). Favourable correlations
were found with egg production (rg = -0.01 to +0.28), percentage yolk (rg= +0.08 to +0.39) and some
shell quality traits like shape index and breaking strength (rg = +0.14 to +0.32), but not with dynamic
stiffness (rg = -0.08 to -0.17).
Hatch of fertile eggs has sufficient genetic variation in these White Leghorn lines to expect improvement by within-line selection, especially if supported by a reduction in total egg weight and selection
for higher egg production, yolk percentage and shell breaking strength.

Introduction
“Genetic potential describes what you can hope to achieve in flock performance if everything goes right. Attainment of this potential, though, is dependent on all of your management decisions, which must be correct from one day of age until the flock completes its laying period” (Bell, 1982).The objectives of our management programs have not changed during the last 30 years. We still see major ranges in all performance traits as the result of the application of producer skills.
In a series of three articles, the emphasis will be on the variation of performance from flock to flock, from producer to producer and from region to region. Data will be presented to illustrate these performance differences from a several year study of commercial table egg flocks in the United States. To remove the variability of results attributable to strain differences, only one strain will be used – the Lohmann LSL Lite. Similar flock variations are seen in all commercial strains which we assume are attributable to rearing and lay management differences.
The extensive volume of data available for this analysis will be presented in three parts:
• Part 1 will concentrate on egg production and egg weight.
• Part 2 will emphasize feed consumption and feed conversion.
• Part 3 will discuss mortality and focus on economic factors
The results to be presented are based on a subset of 74 flocks from 12 large integrated egg production firms located in various regions of the USA. The original study includes more than 200 flocks representing nine different white-egg strains (White Leghorns). Flock size averaged 79,662 pullets and ranged from 25,579 (5 smallest flocks) to 185,249 (5 largest flocks). The total study included 5.8 million hens (Bell, 2008-2011).
These flocks were housed at 18-20 weeks of age in 2001 to 2005. Records for each flock were kept for approximately two years. The majority of flocks were molted between 60 to 80 weeks of age. This report is based upon only one strain – the Lohmann LSL Lite – in order to focus on variation due to management, eliminating variance due to strain differences. Possible genetic changes due to selection within the 5-year period covered are ignored.
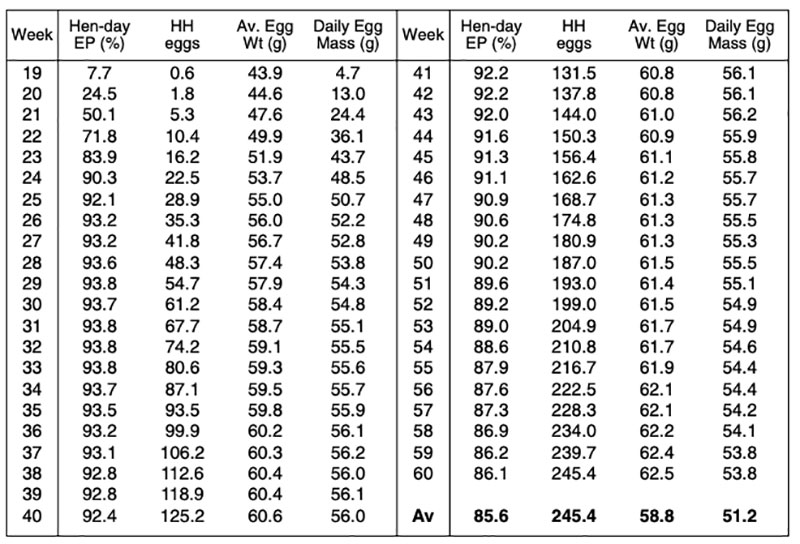
All flocks were kept in cages, and most flocks in controlled environment housing. Before statistical analysis, all records were checked for consistency, and obvious errors were removed. Table 1 lists the egg production and egg weight data for the period 19 to 60 weeks of age.
Data Quality and Analysis
The farms represented in this study had to be willing to share their data and maintain them on a daily basis. Each farm provided the author with weekly calculations for a series of measurements including: rate of lay, mortality, feed consumption per 100 hens per day and sampled egg weights. In addition, some cooperators also provided body weights and water consumption data. Other reports are available from the author on these and other related analyses.Using the farm’s calculated results, we re-calculated their original input figures (number of eggs, weight of feed, and a running count of hens based upon the loss rates reported). This technique worked backwards to exclude any additions to the flock which would have made our results less accurate. Some based their mortality rates on beginning counts which required recalculation of rates based upon “current” counts – a more meaningful method.
The accuracy of data varied from farm to farm. Egg counters are common sources of error. Feed inventories at the end of each week may be estimates or actual weights resulting in high consumption rates one week followed by a lower rate the next. Egg weights are usually sampled once per week. This sampling is particularly subject to error in the choice of a representative location for the sample – egg size varies within the house. As the source data are reviewed, adjustments may be required. This is usually done by interpolating from the data on prior and subsequent weeks.
The data being reported in this study are only a fraction of the overall data collected by the cooperating farms. Most producers have record systems to track individual nutrient intake (amino acids, minerals, energy, etc). All of the producers in this study also have egg cartoning facilities and record collection involves extensive descriptions of the size and quality of eggs being packed.
Table 1 lists the average egg production and egg weight-associated results by week. Complete records to sixty weeks of age were available for all flocks, before molting was induced anywhere between 60 and 80 weeks of age, interrupting weekly results and making averages meaningless. Second cycle performance, water consumption, seasonal performance, and performance of brown-egg vs. whiteegg strains were also analyzed, but will not be reported here
Table 1: Weekly Performance Data
BEST AND POOREST FLOCKS BY INDIVIDUAL PERFORMANCE TRAITS ( 74 U.S. FLOCKS)
In Table 2, the differences between “best” and “poorest” results are shown for different egg production traits. Note that the flocks were sorted on each trait separately, i.e. flocks ranking among the top 5 in one trait may not be “best” in total profitability.The data in table 2 demonstrate the wide variation in results between flocks and farms. The five best flocks exceed the breeder standard, and the comparison with the 5 poorest flocks illustrates the overall range of results that might be attained. The average results of the best 25% flocks may be considered as realistic goals for future flocks. The variability between the 74 flocks is expressed as a “standard deviation” and is shown in “frequency” distribution figures. Standard deviations represent approximately two-thirds of the flocks within plus or minus one standard deviation from the average – the smaller the number, the more uniform are the results.
Table 2: Best and poorest flocks per trait
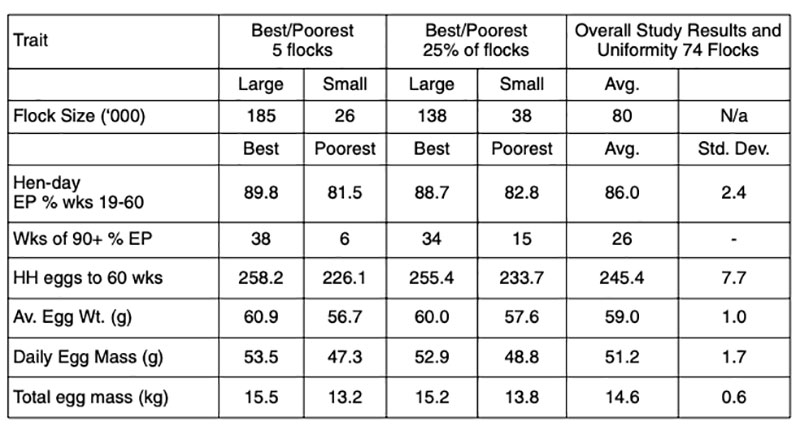
Figure 1. Frequency of Av Hen-day Egg Production Rates – 19 to 60 wks
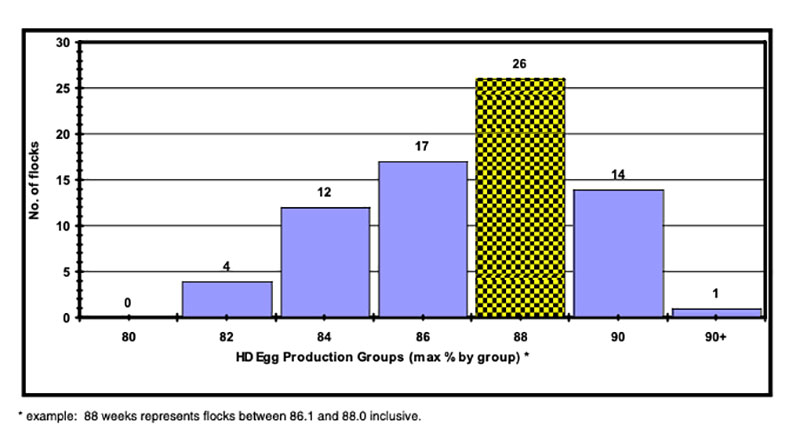
Figure 2: Frequency of Hen-housed Eggs (to 60 wks)
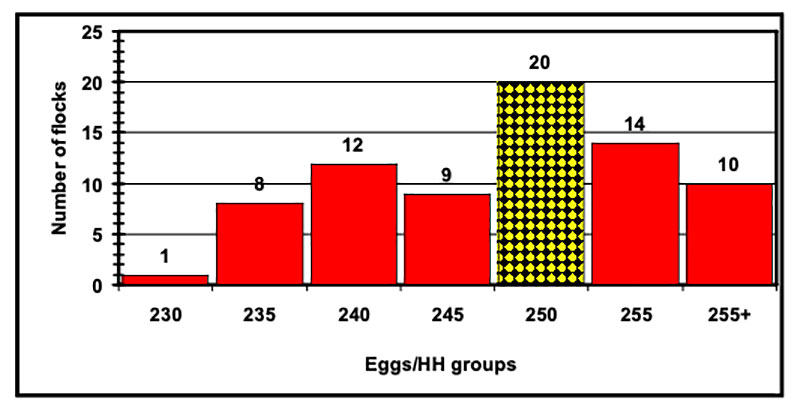
Figure 3: Frequency of Total Egg Mass (kg) – 19 to 60 wks
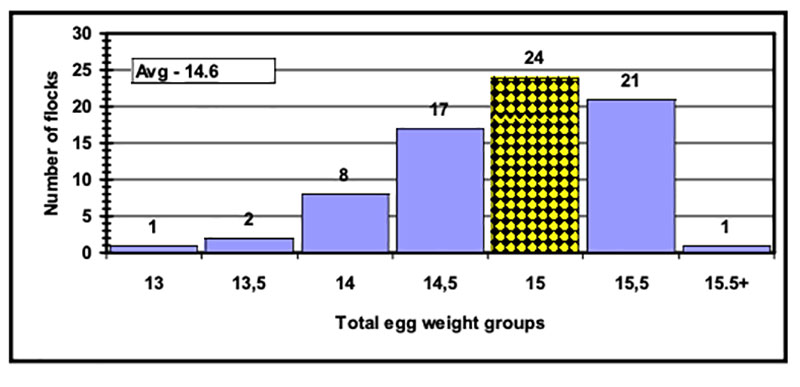
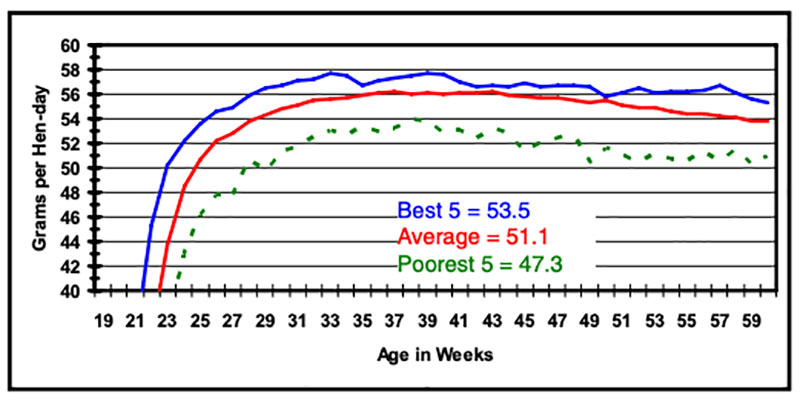
Figure 4: Hen-day Egg Production (%) – 19 to 60 wks
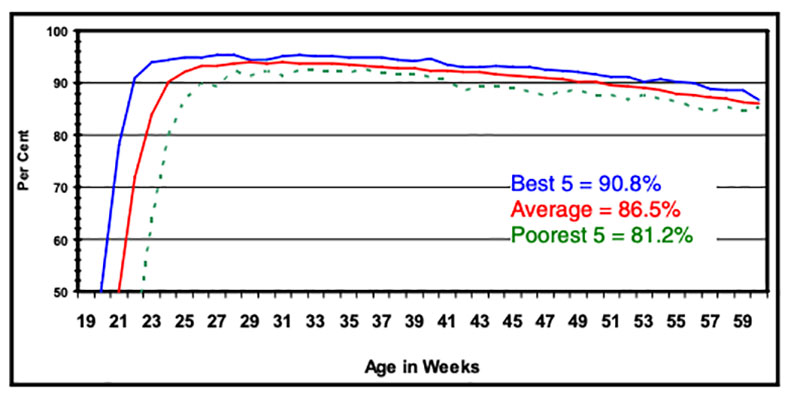
Figure 5: Cumulative Hen-housed Egg Production to 60 wks
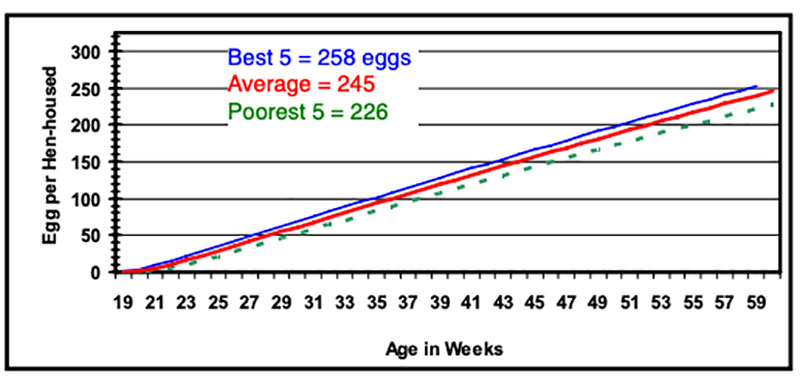
Figure 6: Average Egg Weight (g/egg) – 19 to 60 wks
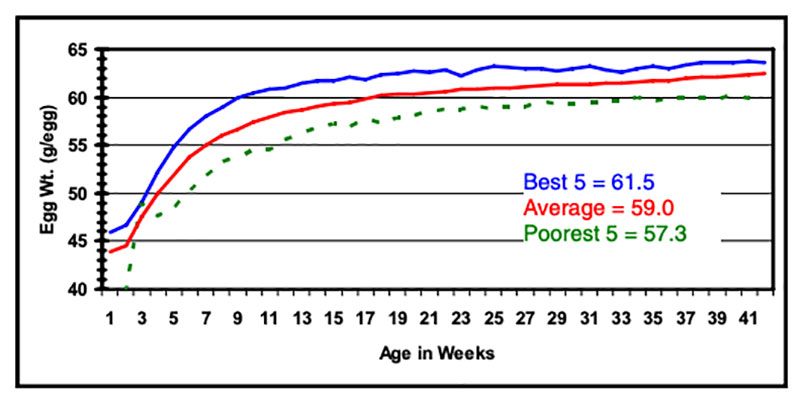
Figure 7: Daily Egg Mass (g) – 19 to 60 wks
Discussion
Significant differences in egg production and egg weight traits between flocks were demonstrated in the data reported above. Comparing just the top 5 and the low 5 flock results, we see differences of 32 eggs in hen-housed egg production and 2.3 kg total egg mass to 60 weeks of age. Since these differences refer to single flocks, the differences between farms will be less extreme. Nevertheless, they suggest major differences in farm management skills on the part of egg producers. Egg mass is calculated by multiplying the rate of lay times the average egg weight in grams. As shown in Figure 7, the maximum egg mass per day in this study is about 58 grams, which is substantially less than the 60 to 64 grams seen in other countries and different strains bred for higher egg weight, e.g. LSL classic. The pricing of eggs in different countries obviously has a major effect on the optimal average egg weight for the producer in a given area. In the U.S., there is little incentive to produce eggs above 60 to 65 grams (47.5 pounds per case) because the pricing system does not reward the producer extra for eggs of that size. Egg producers actually restrict their egg weight because the extra size requires additonal feed without compensation.Flock results are primarily a management tool, i.e. a “warning” that performance may not be up to the standards of the breeder or other egg producers. To identify specific “causes” for such discrepancies requires on-farm consultations.
What are common causes of farm-to-farm differences?
Suboptimal results are associated with things we’ve done incorrectly in the past or in the present time. In other words, the rearing program has a major impact on future results as well as current management. Errors in management during the rearing stage are quite often evident in differences in point-of-lay body weights. These results are commonly seen all the way into production. Get your weights right and you’ll be on your way to optimum performance in your laying flocks.Many management systems can lead to body weight problems and future laying house deficiencies. Major issues include: space allowances, beak trimming, immunization programs, lighting, selection of temperature environments, and general nutrient intake. Dozens of experiments at the formal research and farm-applied levels have shown small (1-5 egg) differences attributable to these factors.
On the other hand, major effects amounting to more than 20 eggs per hen have been observed when the range of normalcy is exceeded. The differences in management can oftentimes result in only small or no differences in performance at normal levels; but when these practices are extended too far, we may see dramatic drops in performance.
In 1973-74 research at the Gleadthorpe Research Facility in the U.K. conducted an important study of the effects of rearing programs (Hearn 1975, 1976). Chicks from a common source (breeder flock) were placed on 12 farms with various management programs. At 18 weeks they were transferred to the main laying facility and maintained with exactly the same hen-house management. Results ranged as listed in Table 3 below.
These results clearly demonstrate the contribution that immature pullet management has on layer performance far into the laying period. It’s important to note that these are not measurements from the same flock; flock profitability has not been evaluated.
Layer management, on the other hand, has a major effect on current results. This has been well documented with many management systems. Space (floor, feeder and watering) is commonly observed to have a 12-20 egg or more effect within the lay house when different allowances are compared.
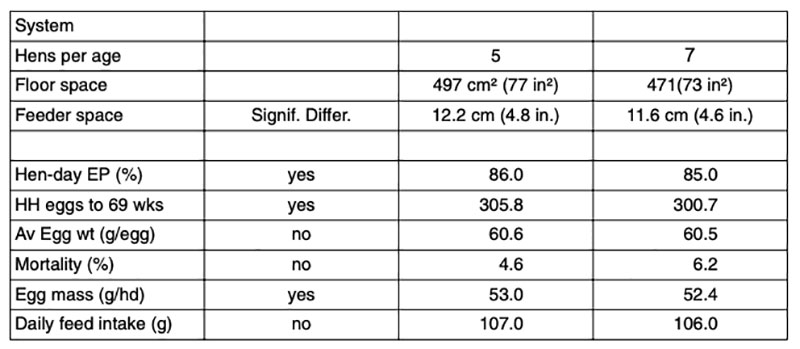
Recent well-designed University experiments at North Carolina State (Anderson, 2001) have shown small but significant performance differences by varying space and hens per cage allowances. Table 4 lists several significant effects of only slight space/density differences from this research.
It is important to note that the differences between these results are attributable to very small differences of floor and feeder space per hen and colony size.
Table 3. Gleadthorpe Flock Results (18 to 72 wks) – ranked by indiv. trait
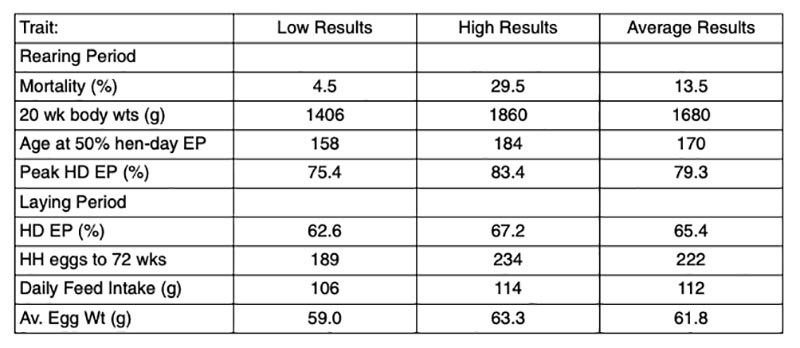
Table 4. The Effects of Small Differences in Cage/Density Types (July, 2011)
(11 White Leghorn strains – to 69 wks of age)
Other factors including health and nutrition can also result in major economic losses. Environment factors (including light, temperature and air quality) have also been shown to affect both rearing and laying results. Some factors may affect results by only a few eggs, but in most cases, these factors have additive effects to the overall results obtained. Most important is that small differences in results can represent a large percentage of overall farm profits. The next article in this series will discuss feed consumption and conversion results based upon the data from this study. After that, we’ll report on the mortality effects and conclude with the overall effects as they affect farm profitability.
References
Bell, D.D. (1982) Pullet Quality. Poultry Digest, August 1982, pp 376, 378, 380.Bell, D.D. (2008 to 2011) Egg Economics Update. University of California Extension publications 285 to 335.
Anderson, K.E. (2001) First cycle report of the 38th North Carolina layer performance and management test.
Hearn, P.J. (1975) Effect of rearing on subsequent egg production.
ADAS Gleadthorpe Experimental Husbandry Farm Poultry Booklet 3: 57-67.
Hearn, P.J. (1976) The effect of rearing on subsequent egg production.
ADAS Gleadthorpe Experimental Husbandry Farm Poultry Booklet 4: 49-55.
Zusammenfassung
Managementbedingte Varianz in der Leistung moderner Legehybriden als HerausforderungTeil 1: Legeleistung und Eigewicht Aus einem größeren Volumen detaillierter Praxisdaten wurden die Leistungen von 74 Herden eines einheitlichen Zuchtproduktes (Lohmann LSL Lite) bis zur 60. Lebenswoche analysiert. Dies ist der erste von drei Beiträgen, in denen die Variation der wöchentliche Legeleistung und des Eigewichtes analysiert wird; in den folgenden Beiträgen sollen die Merkmalskomplexe Futterverzehr und Futterverwertung sowie Tierverluste und Gesamtwirtschaftlichkeit untersucht werden. In den Tabellen 1-3 und den Abbildungen 1-7 werden die wöchentlichen Durchschnitte dokumentiert und die besten und schlechtesten Herden gegenübergestellt, um das Ausmaß der Varianz in einzelnen Merkmalen deutlich zu machen. Anschließend werden unter Hinweis auf veröffentlichte Versuchsergebnisse mögliche Ursachen von Abweichungen vom genetischen Potenzial diskutiert.