


Summary
Hatchability is of considerable economic importance for all hatcheries and therefore must be given
appropriate attention in breeding programs for commercial layers. The variability between and within
strains will tell us whether reproductive performance can be improved by selection within specific
lines. The aim of this study was to analyse the genetic variation of hatchability and correlations with
production traits. Data collected from two pure-bred female lines (LSL) at 45-46 weeks of age were
used. Estimated heritabilities were low (h² = 0.13 and 0.15) for fertility, but moderately high (h² = 0.27
and 0.30) for hatch of ‘fertile’ eggs (eggs transferred at 18 days). Hatchability was negatively correlated
with egg weight (rg = -0.43 to -0.52) and albumen height (rg = -0.25 to -0.42). Favourable correlations
were found with egg production (rg = -0.01 to +0.28), percentage yolk (rg= +0.08 to +0.39) and some
shell quality traits like shape index and breaking strength (rg = +0.14 to +0.32), but not with dynamic
stiffness (rg = -0.08 to -0.17).
Hatch of fertile eggs has sufficient genetic variation in these White Leghorn lines to expect improvement by within-line selection, especially if supported by a reduction in total egg weight and selection
for higher egg production, yolk percentage and shell breaking strength.

Introduction
Global shell egg production has shown remarkable dynamics over the past two decades. This growth was not homogeneous, however, and led to a considerable spatial shift of the centres of egg production. Whereas in 1990 developed countries still contributed over 52 % to global egg production, less developed and threshold countries shared 59 % in 2008. This shift is mainly a result of the fast growth of egg production in Asia, especially in China. In a detailed analysis, which was presented at the IEC spring conference in London, the author documented the dynamic changes of egg production and egg trade and presented a new spatial pattern of the global egg industry. The main results of that study will be presented in this paper.The role of less developed and threshold countries in global egg production
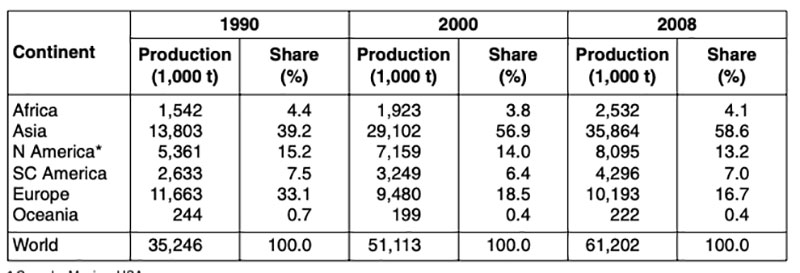
Global shell egg production increased from 35.2 mill. t in 1990 to 61.2 mill. t in 2008 or by 73.6 %. It was, however, not a homogeneous growth as can be seen from the data in table 1. The highest absolute increase showed Asia with 22 mill. t, followed by North America with 2.7 mill. t, Central and South America with 1.6 mill. t and Africa with 1 mill. t. The remarkable increase of the production volume in Asia led to a considerable shift in the spatial pattern of egg production. Whereas in 1990 the contribution of Asian and European countries to the overall global production was still quite similar, the situation had completely changed in 2008. With a share of 58.6 % Asia was in an absolutely dominating position. In the same time period Europe lost almost half of its former share, all other continents were also not able to maintain their former contribution. Europe was the only continent with an absolute decrease of the production volume, it lost 1.5 mill. t. This was mainly due to the socio-economic transformation process in Eastern Europe. The described spatial shift reflects the dynamics of egg production in several less developed and threshold countries.Table 1: The development of global egg production between 1990 and 2008
(Source: FAO database)
The data in table 2 document the dramatic spatial shift which occurred in egg production in the analysed time period. In 1990, developed countries contributed 52.5 % to the global production volume, threshold countries 36 % and less developed countries 11.5 %. Only ten years later, the situation had changed thoroughly. Threshold countries were in a leading position with a share of 56.4 %. Developed countries had lost almost 20 % of their former share. In spite of an absolute growth in production volume, the contribution of less developed countries was lower than in 1990.
In 2008, threshold countries had further strengthened their position. In developed countries, production increased again, but growth rates were much lower than in less developed and threshold countries so that their contribution to the global production volume fell by another 4 %.
Table 2: The development of egg production in less developed, threshold and developed
countries between 1990 and 2008 (Source: FAO database)
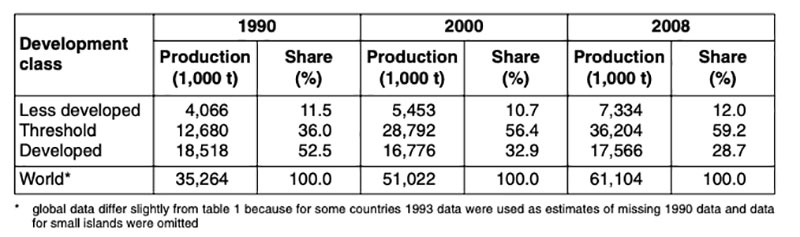
A closer look at the dynamics in the development classes in the analysed time period reveals that of the total increase of 26 mill. t, 23.6 mill. t or 90 % were contributed by threshold countries and almost 3.3 mill. t by less developed countries. Developed countries, on the other hand, lost about 1 mill. t of egg production.
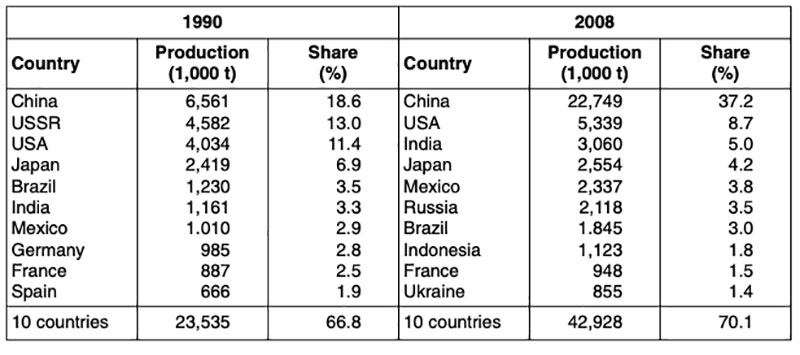
In table 3, the ten leading egg producing countries, independent from their development status, are listed for 1990 and 2008. Of the ten leading countries in 2008, four were located in Asia, three in the Americas and three in Europe. Only one EU member country, France, was left among the top listed egg producing countries. Six of the ten leading countries were threshold countries and four developed countries. This documents the extraordinary role that threshold countries played in the dynamics of global egg production.
Table 3: The ten leading countries in shell egg production in 1990 and 2008
(Source: FAO database)
The role of less developed and threshold countries in world egg trade
Only about 2.6 % of global egg production was traded in 2008; in contrast, 15.5 % of poultry meat was exported in the same year. The main reason for the comparatively low figure is the fact that shell eggs cannot be deep frozen in contrast to meat. On the other hand, eggs have the advantage of a relatively long shelf life and can be consumed as whole eggs without the necessity to refrigerate as in the case of meat.Table 4: The development of global shell egg exports by less developed, threshold and
developed countries between 1990 and 2008 (Source: FAO database)
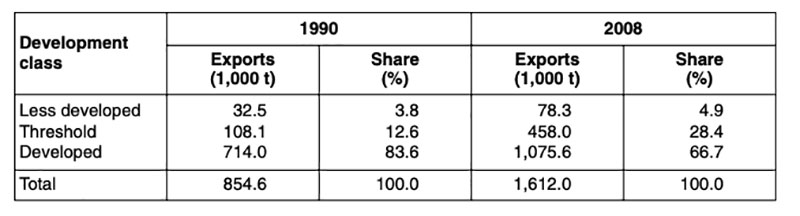
Table 4 shows that global egg exports were dominated by developed countries even though their share decreased by 16.9 % between 1990 and 2008. Threshold countries could expand their contribution by 15.8 % whereas that of less developed countries increased by only 1.1 %. A closer look at the absolute growth rates shows that the export volume of threshold countries increased by almost 350,000 t (+ 324 %), that of less developed countries by 45,750 t (+ 140.6 %) and that of developed countries by 361,600 t (+ 50.6 %). In spite of a smaller share, developed countries are still dominating shell egg exports.
Table 5: The development of global shell egg imports into less developed, threshold and
developed countries between 1990 and 2008 (Source: FAO database)
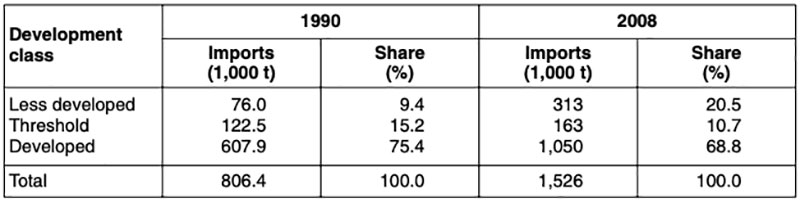 As can easily be seen in table 5, the import pattern differs considerably from the export pattern. In
less developed countries the import volume increased by 237,200 t (+ 312 %), in threshold countries
by only 40,400 t (+ 33 %) and in developed countries by 442,353 t (+ 72.8 %). Obviously, threshold
countries were able to increase egg production much faster than less developed countries and were
able to meet the increasing domestic demand much better. In contrast, in several less developed
countries demand grew much faster than domestic production so that more eggs had to be imported.
As can easily be seen in table 5, the import pattern differs considerably from the export pattern. In
less developed countries the import volume increased by 237,200 t (+ 312 %), in threshold countries
by only 40,400 t (+ 33 %) and in developed countries by 442,353 t (+ 72.8 %). Obviously, threshold
countries were able to increase egg production much faster than less developed countries and were
able to meet the increasing domestic demand much better. In contrast, in several less developed
countries demand grew much faster than domestic production so that more eggs had to be imported.
Perspectives until 2015
In an earlier report to the IEC, the author presented a projection of the egg demand in 2015 compared to 2005 (Windhorst 2008). It was estimated that in 2015 another 12 mill. t of shell eggs would be produced to meet the additional demand (table 6). Asia would then contribute 62.1 % to global egg production, Europe 14.3 %.Table 6: Projected hen egg production in 2015 by continents
(Source: Windhorst 2008, p. 17, modified)
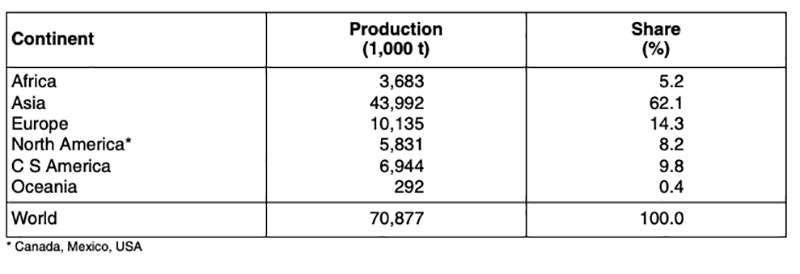
Table 7: Projected egg demand in 2015 by development status of countries; data in 1,000 t
(Source: FAO database; Windhorst 2008, own calculations)
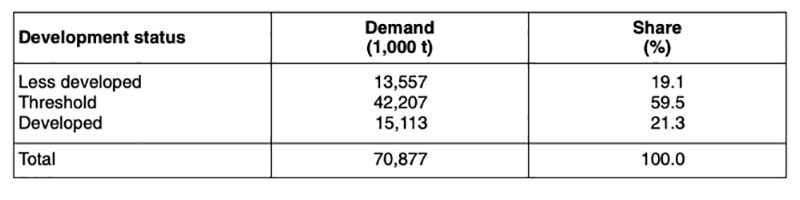
In table 7, such a projection is presented. It is estimated that a total production of 70.9 mill. t will be necessary to meet the global demand. Almost 60 % of global egg production in 2015 will be contributed by threshold countries, 21 % by developed countries and 19 % by less developed countries. If it will be possible in threshold countries as well as in several less developed countries to meet the growing demand by domestic production is a question which cannot be answered at this moment. It can, however, be expected that the present pattern of egg trade will not change thoroughly over the next years. There will still be three major clusters of egg trade, one in Northern America, on in Western Europe and one in South Eastern Asia. A fourth cluster between India and Western Asian countries is developing.
A new spatial pattern of the global egg industry
Because of our own limited experience and the lack of detailed studies dealing with the organisation and spatial pattern of the egg industry in less developed and threshold countries and because of the large number of research papers and the availability of statistical data on the egg industry in developed countries, we only too often forget that the extraordinary development of global egg production over the past twenty years has mainly been a result of the dynamics in a rather limited number of threshold and a few less developed countries. We need to deal more thoroughly with the egg industry in these countries and recognize that the centre of egg production is no longer located in the USA and Western Europe, but in Southern, Eastern und South-Eastern Asia and that a new regional cluster is being formed in some countries in Central and South America. This is the new spatial pattern of the global egg industryReferences
FAO database: faostat.fao.orgWindhorst, H.-W. (2008): A Projection of the Regional Development of Egg production until 2015. IEC Special Report April 2008. London.
Windhorst, H.-W. (2011): Frühjahrskonferenz der IEC – Herausforderungen an die globale Eierwirtschaft sind vielfältig. DGS Intern 17/2011, 3-5
Zusammenfassung
Eine neue räumliche Ordnung der globalen Eierwirtschaft – Die wachsende Rolle von Entwicklungs- und Schwellenländern in der Welteierproduktion und im EierhandelDie Dynamik der globalen Eierproduktion und des Handels mit Schaleneiern wies in den beiden zurückliegenden Jahrzehnten eine bemerkenswerte Dynamik auf. Das Produktionsvolumen erhöhte sich im betrachteten Zeitraum von 35,2 Mill. t auf 61,2 Mill. t oder um 73,6 %. Das Wachstum erfolgte jedoch nicht gleichmäßig. Während sich der relative Anteil Europas an der Welterzeugung zwischen 1990 und 2008 nahezu halbierte, konnte Asien seinen Anteil deutlich erhöhen und rangierte mit 58,6 % weit vor Europa und Nordamerika an der Spitze. Diese Dynamik wurde vor allem durch die starke Steigerung der Erzeugung in einer Reihe von Schwelleländern bewirkt. Sie stellten 2008 bereits 59,2 % der Weltproduktion. Der Anteil der Industrieländer sank im betrachteten Zeitraum demgegenüber von 52,5 % auf nur noch 28,7 %. Besonders hervorzuhaben ist die Sonderstellung Chinas, das 2008 37,2 % zur Welteierproduktion beisteuerte. Die genannten Verlagerungsprozesse wirkten sich auch auf den Handel mit Schaleneiern aus. Trotz deutlicher Einbußen stellten die Industrieländer jedoch noch jeweils zwei Drittel der weltweit getätigten Exporte und Importe. Während die Schwellenländer ihre Ausfuhren deutlich steigern konnten, waren die Entwicklungsländer wegen der schnell steigenden Nachfrage auf zunehmende Importe angewiesen. Im Jahr 2008 wurden gut 20 % aller weltweit gehandelten Eier von Entwicklungsländern eingeführt. Es ist davon auszugehen, dass die Schwellenländer und auch einige Entwicklungsländer ihre Produktion in den nächsten Jahren noch weiter steigern können, die Industrieländer demgegenüber weitere Marktanteile verlieren werden.