


Abstract
Bird eyes generally differ from human eyes, especially within spectral sensitivity and their ability to resolve temporally varying stimuli. Up to now, measurements of light in poultry houses and assessment of illuminants are still based on parameters developed for human perception of light. Differences in the anatomy and physiology of human and avian eyes should be taken into account in order to optimize the lighting conditions in poultry houses. It can be assumed that natural daylight corresponds most closely to the requirements of a bird. Suitable illuminants should cover the whole spectrum contributing to the reception of light, including UV-A light. Spectral data can be compared with reference values for chickens and turkeys, based on their natural habitats. The emitted light frequency should be at least 120 Hz. As a precaution it is advisable to strive for flicker rates in lighting systems including a buffer-range. The comparison of different illuminants offered for poultry houses indicate a need for more research and development to improve the light quality in poultry houses. Furthermore procedures for testing light intensity must be developed which will show the brightness perceived by commercial poultry. Light intensity in poultry houses are commonly measured with lux meters, which cannot detect UV-A light, even though these ultraviolet wavelengths contribute to brightness perception in birds. As a practical approach, tests of light intensity in functional areas of non-cage systems (e.g. feeder and rest area) are recommended, corresponding to varying preferences for different functions.
Keywords
Artificial Lighting, Photometric Units, Daylight Wavelength, UV-A, Animal WelfareCo-Author
S. Döhring, A. Uhlenkamp and R. Andersson
Introduction
Light plays a critical role in the development of feather pecking and cannibalism (Kjaer and Vestergaard, 1999; Kjaer and Sørensen, 2000). The risk and prevention of these misbehaviors is a major challenge if pullets are not beak-treated and laying hens kept in cage-free systems. Good management practice for poultry kept in closed houses must therefore pay special attention to lighting. First of all, it must be understood that the anatomy and physiology of the bird’s eye differs from the human eye (Reese et al., 2009).Light affects poultry by two biological mechanisms: visual perception and effects on the physiology of the birds. The visual perception enables the bird to see pictures. Inside the eye is the retina, an epithelial layer with photosensitive receptors, including cones for (photoptic) seeing of daylight and rods for (skotoptic) seeing of nightlight. Physiological effects of light are important e.g. for endocrine functions, the circadian rhythm and sexual behavior (Lewis and Morris, 2000). Light also affects the hypothalamus and controls the release of sex hormones from the gonads via the gonadotropin releasing hormone (GnRH). Physiological effects of light are used in poultry production, for example, to control the onset of lay or to induce a molt.
Measurement of the bird’s perception of light is essential and a major challenge in developing optimal lighting programs. Parameters describing the quality of light reflect the perception of humans (light intensity in Lux; light color in Kelvin). The commonly used criteria to describe the light environment (e.g. Lux and Kelvin) should be adjusted to the differences between human and bird’s eyes.
Visual perception
The visual perception can be reduced to two basic patterns, „shape“ and „color“, which are used by animals to differentiate between objects which are relevant for their survival. The ability to determine which feed is edible and non-edible and to differentiate aggressors/enemies from possible mates assure the survival of a species. Birds have to cope with a special challenge, because they have to recognize dangers or feed from a distance. It is easier to differentiate distant objects on the basis of „color“ than on „shape“; therefore, color vision is important for birds.Physiology of the eye
The eye contains two functional units: The refracting structures, including tear fluid, cornea, anterior chamber, lenses and vitreous body, concentrate the light waves on the retina (Loeffler and Gäbel 2009). The retina contains the photoreceptor cells of the eye, the rods and cones (Engelhardt et al. 2010). The rods and cones contain photo pigments which change their structure when exposed to light. A cascade of reactions follows, leading to an electric signal. Bipolar cells, ganglia cells, amacrinal cells and horizontal cells in the retina are involved in the connection and transmission via the optic nerve to the brain. The transmission of the signal is electric, as a sequence of action potential (Loeffler and Gäbel 2009). A picture of the environment is generated in the brain. The visual perception of pictures is subjective and an individually learned process (Engelhardt et al. 2010). In humans more than 200 million sensory cells and billions of nerve cells in the brain participate in this process (Frings and Müller 2014). The rods react to mimimal light stimuli (a single photon). However, they cannot detect color and are therefore only able to differentiate between light and dark (skotopic seeing). The cones allow color vision and need a certain light intensity to be activated. The photo pigments of the cones absorb only certain wave lengths of the light, depending on the type of cones (Loeffler and Gäbel 2009). The retina of the human eye contains three kinds of cones, which can be identified on the basis of maximal absorption. The three absorption maxima are long (red), middle (green) or short (blue) waves (Deeg 2009). The wave length of the light is not transmitted directly to the brain. The cones always react in the same way to the corresponding wave lengths (Engelhardt et al. 2010). The strength of the signal depends on the wave length of the light. In order to generate the same strength of signal in green-sensitive cones with long wave (red) light, the intensity of long wave light must be much higher (Frings und Müller 2014).The visual system of birds
The avian vision is highly developed. The special importance of the eyesight for birds may be related to their weight: in fowl-like birds, a pair of eyes typically weighs 7-8.5 % of total body mass, in humans only 1 % (König und Bragulla 2009). The basic structure of the avian eye is similar to the mammalian eye, but displays some additional features (König and Bragulla 2009).- Due to the large eyeball and the relatively large retina surface, the vision and optical resolution are stronger in birds than in humans (Nickel et al. 2004).
- The tear fluids, cornea, anterior eye chamber with fluid, lenses and vitreous body are involved in the refraction of light. Most of the light refraction occurs between the air and tear fluid on the cornea (Deeg 2009, Löffler und Gäbler 2009; Moyes and Schulte 2008).
- In contrast to humans, birds have four kinds of cones. The absorption maximaλmax of the different cones of chickens are as follows: 419 nm (UVS/VS), 455 nm (SWS), 508 nm (MWS), and 570 nm (LWS) (Bowmaker et al. 1997). The UVS pigment in birds appears in two variates: VS pigment with an absorption maximum λmax between 402 nm and 426 nm and UVS pigment with an absorption maximum λmax between 360 nm and 373 nm (Hart 2001). Lind et al. (2013) published an absorption maximum of 418 nm for the VS pigment. Birds also have double cones with an absorption maximum λmax around 580 nm (Hart 2001; Kram et al. 2010). The double cones are assumed to be responsible for seeing movements (Barber and Daly 2013; Kram et al. 2010). For comparison, the absorption maxima of the three cones in the human eye are about 420 nm (blue), 534 nm (green) and 564 nm (red) (Deeg 2009).
- The cones of the human eye recognize only light waves between 380 and 780 nm length (Baer et al. 2016; Ris 2015), while birds can see a much wider color spectrum, including UV light (Barber and Daly 2013; Lewis and Morris 2006; Reese et al. 2009). The figures published for avian vision differ considerably between authors: Prescott and Wathes (1999) reported spectral sensitivityup to 740 nm. According to Hart et al. (1999), chickens can see wave lengths above 330 nm. Slightly higher values of 350 to 360 nm were found by Lewis and Morris (2006), Prescott and Wathes (1999) and Saunders et al. (2008). In the most recent reference, Deeg (2009) concludes that the spectral vision has a range from 320 to 680 nm.
- Birds have a sharper vision than mammals, which is explained by the smaller number of cones per transmitting nerve cell. The avian cones also contain oily droplets (Bowmaker 1977; Maier 1994; Reese et al. 2009) which reduce the specific absorption range of individual cones (König and Bragulla 2009). This enables birds to see more clearly and to differentiate wave lengths or shades of color.
- The ratio of cones to rods is opposite between human and avian eyes: 5:95 % in humans (Curcio, 1990) vs. 85:15 % in chickens (Morris, 1970). The actual numbers are 4.6 million cones and 92 million rods in the human eye compared to 7.5 million cones and 1.3 million rods in chicken eyes (Cebulla et al. 2012).
- Depending on light intensity or luminance, color vision (photopic), twilight vision (mesoptic) or night vision (scotopic) takes place. According to Lindsey et al. (2011) the receptor sensitivity of the optical nerve cells of chickens is > 14 cd/m² (8 Lux) for photopic vision and < 0.8 cd/m² (0.5 Lux) for scotopic vision. Baer et al. (2016) consider > 30 cd/m² (20 Lux) as limit for photopic vision and < 0.01 cd/m² for scotopic vision of the human eye.
- Birds have a higher temporal resolution, i.e. they recognize more pictures per second than humans. The critical Flicker Frequency (CFF) is the frequency at which a series of light stimuli is seen as continuous light. CFF depends on the surrounding brightness (Lisney et al. 2012). Several research groups estimated the CFF for chickens based on behavior tests (Nuboer et al. 1992, Jarvis et al. 2002, Railton et al. 2009, Lisney et al. 2011) and found values between 71.5 and 105 Hz. Based on electroretinogram measurements, Lisney et al. (2012) found a higher CFF of 119 Hz. Due to the lateral position of their eyes,birds (excepts owls) have a monocular visual field which can reach 360° (König and Bragulla 2009). Their binocular visual field is only 26°, compared to 120° for humans (Engelhardt et al. 2010, Barber and Daly 2013). The spatial resolution of birds is therefore poorer than by humans. The limited muscling and lateral position of the eyes is largely compensated in birds by a very flexible head (König and Bragulla 2009).
- Avian eyes are able to adapt more quickly to changing lights (light-dark) than mammalian eyes. This is possible with deliberate movement of skeletal muscles of the iris (König and Bragulla 2009).
- Another peculiarity of avian eyes is that birds can process two different pictures simultaneously, e.g. to use one eye to search for feed while the other is watching for potential enemies (Barber and Daly 2013).
Spectral composition
The color of light emitted by a source ismeasured in terms of temperature, using a black object for reference (Ris 2015). The object changes its color depending on the temperature and is measured in Kelvin (K) to classify the light spectrum for humans. The European standard EN 12464 defines the temperature of a light source in three categories: daylight white (>5.300K), neutral white (3.300 – 5.300K) and warm white (< 3.300 K). This scale of light color is one-dimensional. Rotscholl and Neumann (2015) point out that the parameter temperature of color can easily lead to misinterpretation whenever small differences in color are to be described. The one-dimensional scale (Kelvin) is also inadequate to describe the quality of light for the complex vision of the avian eye. The ability of birds to see UVA light, becomes obvious when photos of an object with standard camera vs. UVA camera are compared (Figure 1). The petals appear monochrome in the "color picture" and show a color gradient in the UVA shot.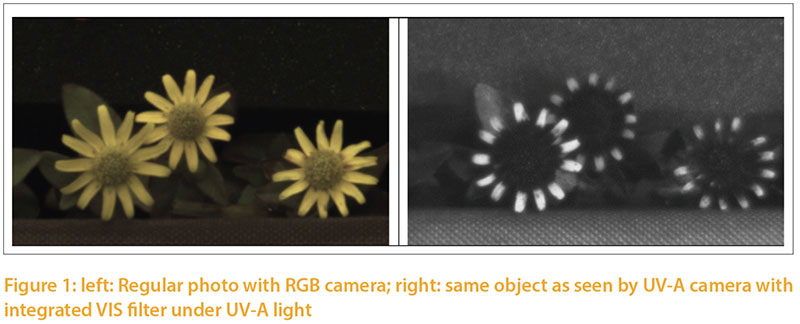 Instead of the simple parameter „light color“ found in commercial illuminants, the complete spectral quality of illuminants needs to be taken into account. The Spectrum should include all areas which are relevant for poultry, including parts in the UV-A range (350–400 nm). Even though the peculiarities of the avian eye and its physiology are known, precise recommendations for optimal illumination of poultry houses are not yet possible. Natural daylight may be used as a reference until more information about artificial light becomes available.
In an earlier publication (Kämmerling et al. 2017) we reported the results of spectral radiometric measurements of the composition of daylight throughout a year at four different locations, characterized as open sky, outskirts of a forest, shrubbery and inside a forest. The natural habitats of different species of domestic poultry differ. Birds which prefer a habitat under the shade of leaves have other requirements for the spectral color range (including UV-A light) than birds preferring to live under open sky. Domestic chickens (Gallus gallus domesticus) are descendants of the Bankiva hen (Gallus gallus). This wild bird lives mainly in the shade of trees and shrubs in the tropical and subtropical jungles of Southeastern Asia. De Castro (2000) described the spectral composition of light in the jungle of Puerto Rico (Central America). The composition is very similar to what we find in our forests. The ancestors of our turkeys (Meleagris gallopavo) are mainly found in steppes, outskirts of forests and open forests in Northern and Southern America.
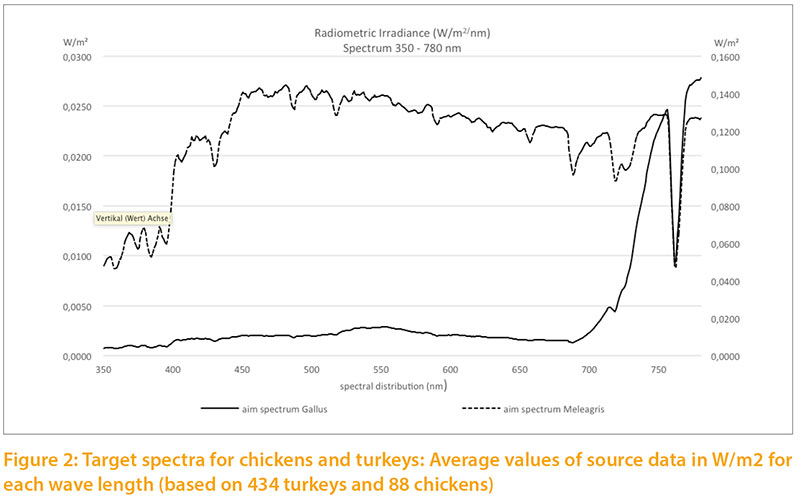
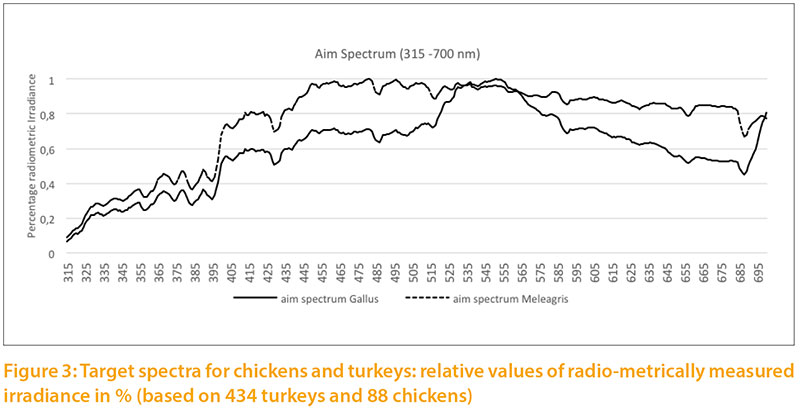
Based on our measurements of daylight, we calculated targets for the light spectrum for chickens and turkeys (Fig.2) corresponding to the natural habitats of these species. For chickens we used the values measured during the summer in the forest and in shrubs. For turkeys we used the measurements throughout the year under clear sky, outskirts of forest and open forest, because the wild species is also exposed to seasonal variation of daylight and steppe conditions with little shade.
The radiometric irradiance shows significant differences between the two target levels. In order to illustrate both curves in one graph, double Y scales were used, which differ by a factor of 10: the target for chickens on the left side, for turkeys on the right side of Figure 2. The curve of Figure3 is only shown to 700 nm to the spectra between 315 and 700 nm.
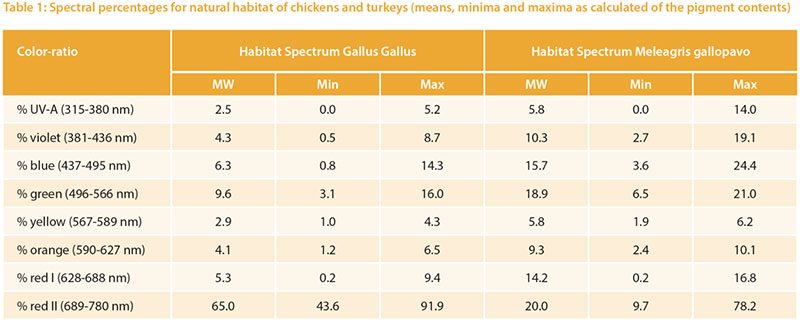
 The relative target values were calculated from the pigment content given in Table 1. The long wave (red) spectrum was subdivided into two areas (I and II) to take the wide range into account. The area „red II“ represents the largest part. The absorption maximum for the corresponding red-sensitive cones of chickens is about 570 m, but above 650 nm the absorption curve tends toward zero (Wilby et al. 2015). An open question is whether the cones would need a higher absorption capacity
at this high intensity or whether the content is of little importance due to the limited absorption capacity of the cones.
The relative target values were calculated from the pigment content given in Table 1. The long wave (red) spectrum was subdivided into two areas (I and II) to take the wide range into account. The area „red II“ represents the largest part. The absorption maximum for the corresponding red-sensitive cones of chickens is about 570 m, but above 650 nm the absorption curve tends toward zero (Wilby et al. 2015). An open question is whether the cones would need a higher absorption capacity
at this high intensity or whether the content is of little importance due to the limited absorption capacity of the cones.Different reference values can be seen especially for UV-A light: 2.5 % for chickens vs. 5.8 % for turkeys, which corresponds to the natural habitat of turkeys (steppes and open forests, with little shade of vegetation). Turkeys are also more sensitive to UV-A light than other poultry species (Barber et al. 2006).
 The spectral composition of common illuminants (light bulb; fluorescent lamp (CFL); LED cool white; LED warm white) differs considerably, as shown in Figure 4. None of these illuminants meets the estimated needs of poultry. Typical illuminants are compared with the reference values.
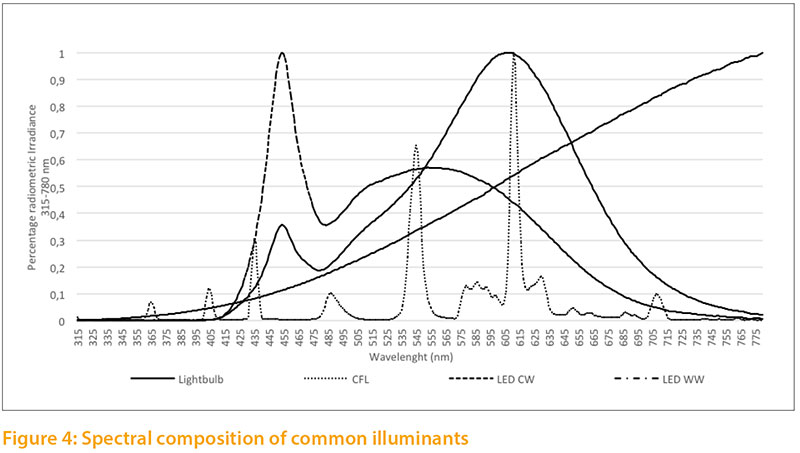
- Light bulb: Light is generated by a Wolfram wire glowing at a temperature of about 2400-2700 °C (Baer et al. 2016). The majority of the generated radiation is in the infrared region. In the visible range, the light bulb showed high emissions in the deep red area (red II) and low emissions in the UV-A and purple area.
- CFL: Compact fluorescent lamps function with low pressure discharge. The gas contained in the glass cylinder consists mainly of mercury vapor, which is made to shine with a cathode. Coating of the lamp converts the resulting ultraviolet radiation (253.7 nm) to visible light (Baer et al. 2016). The sample CFL we analyzed showed a very heterogeneous distribution within different wave lengths. On the one hand, we found sufficient emission in the UV-A und violet area relative to the reference values; on the other hand, some colors like green and orange were prominent.
- LED CW und LED WW: depending on their structural property, light emitting diodes can produce visible light with different semiconductors. The most common structure is a combination of a blue LED-Chip and one or more luminescent substances which convert the emitted blue light into longer waves (green, yellow and red light). Depending on the luminescent substance used, the blue LED emits in warm white (WW) or cold white (CW) (Baer et al. 2016). The LEDs analyzed (CW, WW) emitted very little in the UV-A or violet area. LED CW emitted mainly in the blue-green range, LED WW mainly in the orange and red (Red I) range.
Frequency
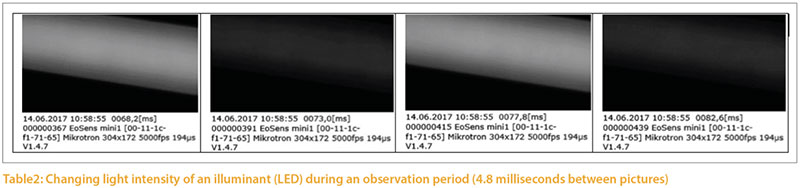
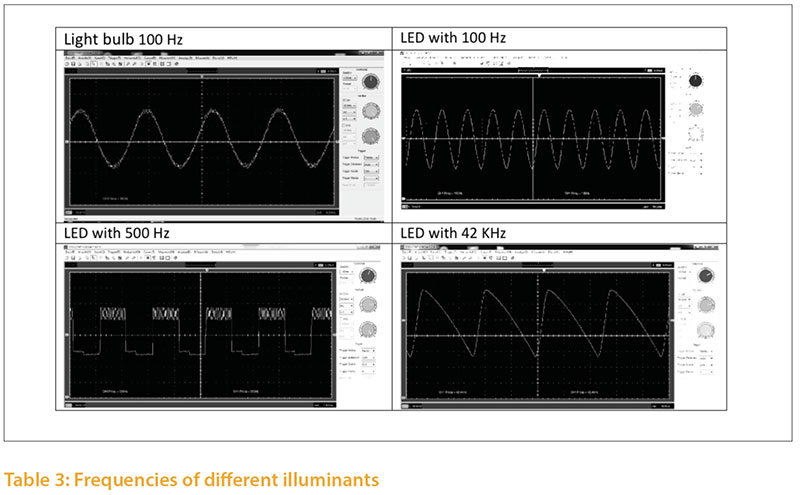
Illuminants emit light with different frequencies, which are expressed in Hertz (Hz). Studies of the flicker fusion frequency of poultry show a range between 20 and 119 Hz (Nuboer et al. 1992, Jarvis et al.2002, Railton et al. 2009, Lisney et al. 2011). The flicker fusion frequency also depends on the light environment.The differences in light intensity can be documented with a high speed camera (5000 pictures/second); an example is shown in Figure 3. The light intensity fluctuates (modulates) to a significantly different degree in different illuminants.
The frequency of an illuminant may also be analyzed with an oscilloscope and a photodiode (Tab. 4) The frequency of an illuminant may be influenced by the operating mode used. Depending on the control gear and driver, dim level etc., the same illuminant may emit different frequencies. In order to assess the critical flicker frequency (CFF) of an illuminant, the whole installation, including power supply, technical control and illuminant, must be analyzed using Fast Fourier Transform technique (FFT).
The frequency of the lighting system in poultry houses should be at least 120 Hz. Taking individual variation of resolving capacity as well the lighting systems in poultry houses should provide for frequencies of more than 120 Hz.
Light intensity
 Light intensity is measured in LUX. 1 LUX= 1 Lumen/m². The light intensity doesn`t describe the brightness perception of the eye. Luminance (cd/m²), on the other hand, describes the brightness impression of the eye. When the actual light intensity is measured, e.g. to check compliance with animal welfare regulations, a lux meter is commonly used. However, this device only yields a photometric value which takes the spectral sensitivity of the human eye into account. The unit lux or lumen is meaningful for the human eye, but birds have a different spectral sensitivity and require different specifications of light, including UV-A light. The units for such measurements are called „Galli-Lux“, „Clux“ or „Light index for Poultry“. Photometric
values of Light intensity for chickens may be calculated with the following formula (Gall 2007):
Light intensity is measured in LUX. 1 LUX= 1 Lumen/m². The light intensity doesn`t describe the brightness perception of the eye. Luminance (cd/m²), on the other hand, describes the brightness impression of the eye. When the actual light intensity is measured, e.g. to check compliance with animal welfare regulations, a lux meter is commonly used. However, this device only yields a photometric value which takes the spectral sensitivity of the human eye into account. The unit lux or lumen is meaningful for the human eye, but birds have a different spectral sensitivity and require different specifications of light, including UV-A light. The units for such measurements are called „Galli-Lux“, „Clux“ or „Light index for Poultry“. Photometric
values of Light intensity for chickens may be calculated with the following formula (Gall 2007):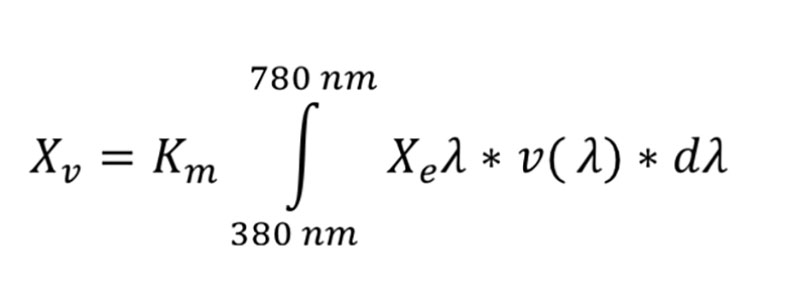 where
where
- Km is a constant, in lm/m2 units. Depending on the kind of vision (scotopic, mesopic, photopic), different values are used
- Xeλ is the measured intensity of radiation in W/m² relative to the sum (∫) of radiation of all wave lengths der in the visible area (380-780 nm for humans; 350-780 nm for poultry)
- v(λ) is the spectral light sensitivity, which differs between humans and poultry (Lewis and Morris 2006)
- dλ is the resolution of the measured intensity of radiation (dλ = 1, if a value is available for each wave length)
The constant (Km) for photopic vision refers to the absolute light intensity which is sensed, but for application the differences between human and avian vision must be taken into account. This question has to be answered before poultry pecific values like „Gallilux“, „Clux“ or „Light Index forPoultry“ can be compared with photometric units in LUX.
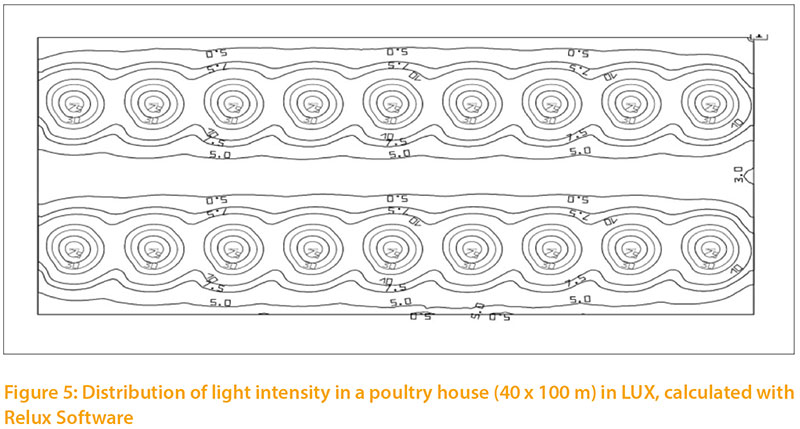
The distribution of light intensity in a poultry house is important. Light spreads simultaneously from a source in all directions, and the light intensity at any distance is inversely proportional to the squared distance. If the light cone has a given angle, he light will spread out in a larger cross-sectional area: at twice the distance, four times the area will be illuminated, and light intensity per cm² will be reduced accordingly. There will always be differences in light intensity (Fig.5), depending on the angle and distance from the illuminant.
A specific ilumination oft the barn, differentiate to functional areas, may be of interest.
Summary and Conclusions
Up to now, measurements of light in poultry houses and assessment of illuminants are still based on parameters developed for human perception of light. Differences in the anatomy and physiology of human and avian eyes should be taken into account in order to optimize the lighting conditions in poultry houses. Commonly used criteria (e.g. Lux and Kelvin) must be adjusted accordingly. Illuminants for poultry houses should include spectrum, frequency and light intensity (distribution of brightness). The light color (Kelvin) appears to be inadequate for the assessment of the spectrum, because it only reflects the wave length with maximal intensity. Suitable illuminants should cover the whole spectrum contributing to the reception of light, including UV-A light. Spectral data can be compared with reference values for chickens and turkeys, based on their natural habitats.In order to assess the critical flicker fusion frequency of illuminants, the higher resolution of avian eyes has to be taken into account. The emitted light frequency should be at least 120 Hz. A generous additional safety margin is highly recommended, because individuals may vary in their flicker fusion frequency. Light intensity in poultry houses is commonly measured with lux meters, which cannot detectUV-A light. Birds are therefore likely to see their environment brighter than the measurement suggests. Procedures for testing ust be developed which will show the brightness perceived by commercial poultry. As a practical approach, preference tests of light intensity in functional areas of non-cage systems (e.g. feeder and rest area) are recommended. The comparison of different commercial illuminants for poultry houses indicate a need for more research and development to improve the light quality in poultry houses.
Literature
Baer, R., M. Barfuß und D. Seifert (2016) Beleuchtungstechnik. Deutsche Lichttechnische Gesellschaft. 4. Auflage. Berlin: Huss-Medien GmbH.
Barber, J. und J. Daly (2013) Das Huhn. Geschichte, Biologie, Rassen. Bern: Haupt.
Barber, C.L., N.B. Prescott, J.R. Jarvis, C. Le Sueur, G.C. Perry and C.M. Wathes (2006) Comparative study of the photopic spectral sensitivity of domestic ducks (Anas platyrhynchos domesticus), turkeys (Meleagris gallopavo gallopavo) and humans. British Poultry Science 47: 365–374.
Bowmaker, J.K., L.A. Heath, S.E. Wilkie and D.M. Hunt (1997) Visual pigments and oil droplets from six classes of photoreceptor in the retinas of birds. Vision Research 37: 2183–2194.
Bowmaker, J. K. and A. Knowles (1977) The visual pigments and oil droplets of the chicken retina. Vision Research 17: 755-764.
Castro, F. de (2000) Light spectral composition in a tropical forest: measurements and model. Tree Physiology, 49–56.
Cebulla, C.M., C.P. Zelinka, M.A. Scott, M. Lubow, A. Bingham, S. Rasiah, A.M. Mahmoud and A.J. Fischer (2012) A Chick Model of Retinal Detachment: Cone
Rich and Novel. PLoS ONE 7(9): e44257. doi:10.1371/journal.pone.0044257
Curicio, C. A. and A.A. Kimberly (1990) Topography of Ganglion Cells in Human Retina. The Journal of Comparative Neurology 300: 5-25.
Deeg, C.A. (2009) in: Physiologie der Haustiere. 3. Auflage. Herausg. Wolfgang von Engelhardt. Stuttgart: Enke.
Engelhardt, W. von, G. Breves und C. Aurich (2010) Physiologie der Haustiere. 3., vollst. überarb. Aufl. Stuttgart: Enke.
Frings, S. und F. Müller (2014) Biologie der Sinne. Vom Molekül zur Wahrnehmung. Berlin, Heidelberg. Imprint: Springer Spektrum.
Gall, D. (2007) Grundlagen der Lichttechnik. Kompendium. 2. Aufl. München, Bad Kissingen, Berlin, Düsseldorf, Heidelberg: Pflaum (Licht und Beleuchtung).
Hart, N.S, J.C. Partridge and I.C. Cuthill (1999) Visual pigments, cone oil droplets, ocular media and predicted spectral sensitivity in the domestic turkey (Meleagris gallopavo). Vision Research 39: 3321–3328. Hart, N.S. (2001) The Visual Ecology of Avian Photoreceptors. Progress in Retinal and Eye Research 20: 675–703.
Jarvis, J.R., N.R. Taylor, N.B. Prescott, I. Meeks and C.M. Wathes (2002) Measuring and modelling the photopic flicker sensitivity of the chicken (Gallus g. domesticus). Vision Research 42: 99-106.
Kämmerling, D., S. Döhring, C. Arndt und R. Andersson (2017) Tageslicht im Stall – Anforderungen an das Spektrum von Lichtquellen bei Geflügel. In: Berliner und Münchener Tierärztliche Wochenschrift. Kjaer, J.B. and P. Sørensen (2002) Feather pecking and cannibalism in free-range laying hens as affected by genotype, dietary level of methionine + cystine, light intensity during rearing and age at first access to the range area. Applied Animal Behaviour Science 76: 21-39.
Kjaer, J. B. and K.S. Vestergaard (1999) Development of feather pecking in relation to light intensity. Applied Animal Behaviour Science 62: 243-254.
König, H.E. und H. Bragulla (2009): Anatomie der Vögel. Klinische Aspekte und Propädeutik; Zier-, Greif-, Zoo-, Wildvögel und Wirtschaftsgeflügel. 2. Aufl. Stuttgart: Schattauer.
Kram, Y. A., S. Mantey and J.C. Corbo (2010) Avian Cone Photoreceptors Tile the Retina as Five Independent, Self-Organizing Mosaics. PLoS ONE 5(2): e8992. doi:10.1371/ journal.pone.0008992
Lewis, P.D. and T.R. Morris (2000) Poultry and coloured light. Worlds Poultry Science Journal 56: 189-207.
Lewis, P.D. and T.R. Morris (2006) Poultry lighting. The theory and practice. Andover: Northcot.
Lind, O., M. Mitkus, P. Olsson and A. Kelber (2013) Ultraviolet vision in birds: the importance of transparent eye media. Proc. Royal Society B: Biological Sciences 281 (1774), S. 20132209.
Lisney, T.J. B. Ekesten, R. Tauson, O. Håstad and A. Ödeen (2012) Using electroretinograms to assess flicker fusion frequency in domestic hens Gallus gallus domesticus. Vision Research 62: 125-133.Lisney, T.J., D. Rubene, J. RÓzsa, H. Løvlie, O. Håstand and A. Ödeen (2011) Behavioural assessment of flicker fusion frequency in chicken Gallus gallus domesticus. Vision Research 51: 1324-1332.
Löffler, K. und G. Gäbel (2009) Anatomie und Physiologie der Haustiere. 12. Auflage. Stuttgart: Eugen Ulmer (UTB, 13).
Maier, E.J. (1994) Das UV-Sehen der Vögel: Neue Ergebnisse über den spektralen Sehbereich der Vögel. Journal für Ornithologie: 179–192.
Moyes, C.D. und P.M. Schulte (2008) Tierphysiologie. München: Pearson Studium. Morris, V.B. (1970) Symmetry in a Receptor Mosaic Demonstrated in the Chick from the Frequencies, Spacing and Arrangement of the Types of Retinal Receptors. Journal Comp. Neur. 140: 359-398.
Natesan, A., L. Geetha and M. Zatz (2002) Rythm and soul in the avian pineal. Cell and Tissue Research 309: 35-45.
Nickel, R., A. Schummer, E. Seiferle, B. Vollmerhaus und F. Sinowatz (2004) Anatomie der Vögel. 3. Aufl. Stuttgart: Parey (Lehrbuch der Anatomie der Haustiere, / Richard Nickel, August Schummer, Eugen Seiferle). ISBN: 9783830441496.
Nuboer, J.F.W., M.A.J.M. Coemans and J.J. Vos (1992) Artificial lighting in poultry houses – are photometric units appropriate for describing illumination intensities? British Poultry Science 33: 135–140.
Prescott, N. B. and C.M. Wathes (1999) Spectral sensitivity of the domestic fowl (Gallus g. domesticus). British Poultry Science 40: 332–339.
Railton, R.C.R., T.M. Forster and W. Temple (2009) A comparison of two methods for assessing critical flicker fusion frequency in hens. Behavioural Proc. 80:196-200.
Reese, S., R. Korbel und H.-G. Liebich (2009) Sehorgan (Organum visus) In: König, Korbel und Liebich (Hrsg.) „Anatomie der Vögel. Klinische Aspekte und Propädeutik“. 2. Auflage. Stuttgart: Schattauer.
Ris, H.R. (2015) Beleuchtungstechnik für Praktiker. Grundlagen, Lampen, Leuchten, Planung, Messung. 5. Aufl. Berlin. Fehraltorf/ Schweiz: VDE-Verl.; Electrosuisse.
Rotscholl, I. und C. Neumann (2015) Die Farbtemperatur in der Lichttechnik. Saunders, J.E., J.R. Jarvis and C.M. Wathes (2008) Calculating luminous flux and lighting levels for domesticated mammals and birds. In: Animal 2 (06).
Steigerwald, K. (2006) Sehleistung des Vogelauges – Perspektiven und Konsequenzen für die Haltung von Zier- und Wirtschaftsgeflügel unter Kunstlichtbedingungen.
Wilby, D., M.B. Tommey, P. Olsson, R. Frederiksen, M.C. Cornwall, R. Oulton, A. Kelber, J.C. Corbo and N.W. Roberts (2015) Optics of cone photoreceptors in the chicken (Gallus Gallus domesticus). Journal of royal society Interface 12, 20150591.