


Summary
The production of edible protein of animal origin is the primary objective of livestock husbandry. The
protein intake of people in developed countries is high (more than 50 g per capita daily from animal
origin) and rising incomes in developing countries lead to elevated demand and consumption of meat,
fish, milk and eggs.
On this basis, the following questions must be answered: “Can the Earth feed everyone in the long
term?”, “Are we making efficient use of the Earth’s natural resources?”, “What role do animals play in
all of this and how should they be treated?” Some answers are given in this paper.
In the first part, fundamentals are presented such as protein production of various animal species
(depending on their performance), need for arable land per capita (depending on plant and animal
yields), animal protein consumption per capita and the connection with food security and food safety.
In the second part, the book “Protein – Population – Politics” is reviewed in some detail. This book
(10 chapters, 160 pages) was primarily written for people outside the scientific community and shows
the responsibility of politicians, scientists and farmers for future developments to satisfy the physiological needs and wishes of humans under consideration of physiological, ecological, economical
and ethical aspects. In some cases more questions are arisen than answers could be given. Future
challenges for all those involved in animal production are shown.
Introduction
Livestock improvement through selection has been remarkably successful over the last 50-100 years, despite some industries adopting and implementing modern principles more slowly than others. The foundation for improvement in all livestock industries has been quite simple – the selection of aboveaverage candidates to be the parents of the next generation. Within that context, there have been a number of major changes. The manner and scope for defining overall merit has evolved from visual appraisal against an ideal, to a performance-based approach. In some industries it has gone further to a single index value representing aggregate economic merit, by combining evaluations on a portfolio of traits according to their economic values. There has been continuous evolution of the technical approaches to combine information on correlated traits and on relatives to improve the accuracy of prediction in the selection candidates. However, in most species, the approach using pedigree and performance information has suffered from a major technical drawback that has limited the annual response to selection. Genomics now offers the potential to overcome that limitation and revolutionize breeding programs in most species. Genomic methods for predicting merit of livestock are being adopted and implemented more rapidly than any other selection technologies. This paper describes the limitation posed by pedigree and performance information, and the manner in which genomic information offers promise to change that circumstance. The current status of genomic approaches and possible future directions will be briefly reviewed.Genetic progress
The purpose of artificial selection is to achieve controlled improvement of a population. The annual rate of genetic progress (ΔG) is dictated by the rate of improvement per generation (Hazel, 1943), and the generation interval (L) or time taken for the parental generation to be replaced by their selected offspring. The improvement per generation is dictated by the amount of genetic variation (σg), the intensity of selection (i) and the accuracy of selection (r). The accuracy of selection is the correlation that would be observed if it were possible to relate true and estimated genetic merit. In practice, that correlation can be derived from a statistical basis, without recourse to the true, unknown breeding values. The well-known formula for annual genetic gain is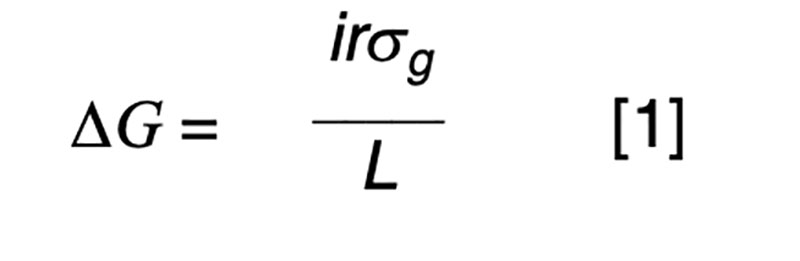
We need not concern ourselves with the details that selection is typically not for a single characteristic but for some form of aggregate merit involving a number of traits that may be favorably or, more commonly, unfavorably correlated, and that the components of the equation (i, L and r) commonly differ by sex and pathway of selection. Our interest is in manipulating the breeding scheme to achieve a high rate of annual gain in a cost-effective manner, whereby the benefits of the improvement greatly exceed the costs of the breeding program. This is most easily achieved when the measurement and selection activities are focused on a small nucleus or seedstock sector of the industry that provides germplasm to meet the demands of the entire industry. Reproductive advances such as artificial insemination have allowed this to happen in dairy cattle, whereas a multiplier sector has been used in natural mating beef cattle populations, pigs and poultry. In the latter two industries the short generation intervals and higher prolificacy can be exploited to minimize genetic lag between the nucleus and commercial sectors.
A naïve approach to increase gain would be to practice intense selection by choosing only a small proportion of available candidates and using them widely, collecting lots of information on the selection candidates or their relatives to achieve accurate prediction of merit, and carrying out selection no later than puberty in order to minimize the generation intervals. Sadly, this approach is seldom practical because achieving high accuracy in a large number of selection candidates typically has a high cash cost, and would delay selection for traits that cannot be measured by puberty, prolonging generation intervals. Effective improvement programs have evolved in most species to carefully balance selection intensity, accuracy of selection and generation interval in relation to the cost and value of genetic gain. In dairy cattle, with sex-limited lactation traits, bulls have routinely been progeny tested before widespread use. In contrast, broiler breeders can phenotype selection candidates for many of the important traits by puberty, enabling rapid improvement without delaying generation intervals to increase selection accuracy.
Conventional pedigree and performance-based selection
Fundamental to an understanding of selection is the model equation for phenotypic performance, which simply defines phenotype as the additive result of genotype and residual effects, perhaps influenced by some systematic non-genetic factors or nuisance effects such as flock/year, age or sex. The goal for prediction is to use available information, such as pedigree and performance records, to derive an estimate of the genetic merit that is in some sense best. The best estimator might be one that minimizes the variance of the prediction errors (i.e. the differences between the true and the estimated merit) or maximizes the correlation between true and estimated merit. It turns out that in circumstances where the genotypic and residual effects are normally distributed, the two definitions of best are obtained by the same approach, and the estimator is a linear function of all the available sources of information. That is, merit is estimated by adjusting each phenotypic record by a particular estimate of systematic non-genetic effects, and then weighting the resultant deviations across traits and relatives with weights derived specifically for each individual and trait. Most of the information comes from the nearest relatives and from highly correlated traits, so these sources have weights with larger magnitude than do other sources.The average accuracy of prediction based on particular sources of information is a function of the sources and respective weights. The square of the accuracy is referred to as the reliability (r²) in some livestock industries, and that value is of interest as it can be interpreted as the proportion of variation in true merit that can be accounted for using the information at hand. Another interpretation is that 1-r² is the proportion of genetic variance in merit that cannot be explained given the available information.
Even with near perfect information, the upper limit is r² ≤0.25 if one parent is known and r² ≤0.5 if both parents are known. These values correspond to r ≤0.5 or r ≤0.7, respectively, limiting gain per generation to 50 – 70% of what could be achieved if candidates could be perfectly assessed by selection age.
Many of the traits that are economically important in breeding programs cannot be measured by puberty, nor in both sexes (e.g. milk yield, egg size), or cannot be measured without sacrificing the
animal as a breeding prospect (e.g. meat tenderness, disease resistance), or waiting until the end of its life (e.g. longevity). Many others are simply too expensive to measure on every candidate (e.g. feed intake). Further, even when the selection candidate can be measured early in life, the value of that information is limited by the heritability of the trait. Individual breeding values for low heritability traits cannot be accurately assessed without measuring large numbers of progeny. The net effect is that reliability of estimated overall merit is typically sub-optimal at puberty.

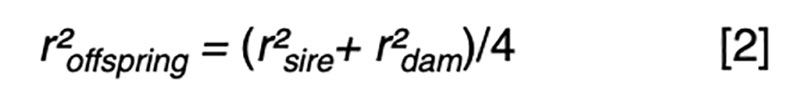
The coefficients of 0.5 on the merit of the sire and dam can be justified by the fact that livestock species have chromosomes in pairs, and only one member of each pair is passed on to the offspring. In the absence of any information other than pedigree, we must assume a random or average half sample is inherited. This formula has implications on the contributions of various sources to the observed variation. Consider a random mating unselected population. We might reasonably expect such a population to exhibit the same genetic variance from one generation to another, and in both sexes. That is, we expect
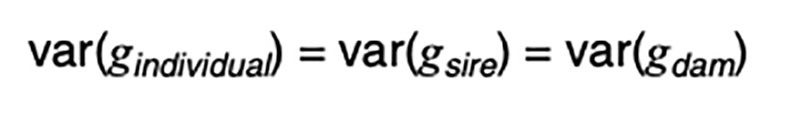
It is a statistical fact that the variance of a random variable scaled by a constant is the square of the constant times the variance of the unscaled random variable. That is, for a constant k,

Applied to [3], assuming random mating giving zero covariance between the sire and dam, and zero covariance between sire (or dam) and the Mendelian sampling term, it is apparent that the choice of sire contributes 0.5²=0.25 genetic variance to the next generation, as does the choice of dam, implying that var(φ) = 0.5 in order for genetic variation to be maintained. If there were no variation due to Mendelian sampling, the genetic variance would halve each generation and soon disappear as mutations are somewhat rare events.
The biological mechanisms for the deviation from parent average is the creation of new chromosome combinations from crossing-over between existing homologous pairs, and the chance sampling of one member from each chromosome pair, accumulated over all the chromosome pairs.
The goal in predicting genetic merit of selection candidates would be to achieve high accuracy by puberty, or preferably even earlier if costs are incurred in managing selection candidates until puberty. This cannot be achieved by performance recording, except for that subset of economically-relevant traits that have a high heritability and can be measured cheaply by puberty. In the broiler industry, this may not pose as much of a limitation as it does in the layer industry
The genomic promise
Knowledge of the genes responsible for variation in traits would allow a different approach to genetic evaluation. Rather than assuming an offspring inherited a random half sample of its genome from each parent, we could inspect the DNA and perfectly characterize the inherited fraction. We would not even need to know the parents. This approach would not require phenotypic observations and could be done at birth or perhaps earlier. This is the current status of some inherited diseases and many other monogenic traits in livestock. Much of the molecular work undertaken over the last 2-3 decades has had the goal of identifying genes that account for a significant proportion of variation in economically important traits that are typically polygenic rather than monogenic in nature.It is unrealistic to expect that we could identify every polymorphism, many of which will be of no consequence, nor screen them all to find the few responsible for inherited variation. The 1,000 genome project in humans is currently identifying about 500,000 new single nucleotide polymorphisms (SNP) in every individual sequenced. Without knowledge of all the polymorphisms, we must be content to find genomic clues that indicate the presence of causal genes. This is akin to detecting planets by observing light reflected off them at some time in the past. In the context of the genome, we rely on a phenomenon known as linkage disequilibrium (LD) to provide evidence of important genomic regions. Various strategies exist to create or exploit LD.
The well-known Hardy Weinberg law applies to large random-mating populations and indicates that in the absence of selection, migration, mutation and drift, the genotypic proportions can be predicted from allele frequencies, and vice versa. Mendel established a law of independent assortment, or linkage equilibrium (LE), which might be universally true if every gene were on its own chromosome, but does not account for physical linkage between nearby genomic locations on the same chromosome. A typical chromosome has about one recombination event per meiosis, which can quickly break down association that might exist between distant genes on the same chromosome due to selection, migration, mutation etc. Imagine a new mutation or the migration of an individual into a population carrying a novel mutation. That mutation would tend to be preserved within the context of nearby alleles sharing the same DNA strand, until a recombination event occurred between them. Alleles that are closer to the mutation will take longer for their linkage to break down by recombination. The ability of an allele to act as a surrogate that can be used to predict some other particular allele is measured by LD. One unit for measuring LD is the correlation between alleles, or the correlation between the genotypes (number of copies of particular alleles) at two genomic locations.
Loci that are on different chromosomes are expected to exhibit LE at the population level, at least in the absence of selection that creates complications such as the Bulmer effect (Bulmer, 1971). Loci nearby on the same chromosome are more likely to exhibit pairwise LD, with the amount of LD tending to increase as physically closer pairs of loci are compared. However, even very close loci may exhibit LE, for example if they are ancient polymorphisms and recombination events have broken up their historical relationship. In order to find every causal mutation, we would need to have a lot of markers.
Early studies to detect QTL typically used micro-satellite markers (Spelman et al., 1996) that can be highly polymorphic, having many alleles at some loci. Some studies took advantage of family structures to create LD. Within every half-sib family there is LD even for markers that exhibit LE at population level, so within family analyses such as the grand-daughter design (GDD) used in dairy cattle (Weller et al., 1990) can use sparse marker genotypes to exploit LD. Other studies used crosses between distant lines or breeds that result in F1 individuals that have one chromosome in each pair from each of the lines or breeds. There will be long-range LD in the F2 animals, which can be exploited using flanking markers to test for the presence of putative QTL at various locations between the markers. The high cost of genotyping resulted in most GDD and F2 experiments having too few animals to identify any but the largest QTL.
These circumstances all changed with the recent sequencing of the bovine and other livestock species. Those endeavors generated many SNP markers and provided a reference sequence. A subset of known bovine SNP were selected for genomic coverage and minor allele frequency to produce an Illumina 50k SNP chip, and most other livestock species have followed with public or private highdensity panels with similar numbers of markers. Rather than exploiting LD due to family structure, these panels provide opportunities to exploit ancestral LD, at least for that fraction of the QTL that happen to be in LD with the markers on the panel. The technology that enables simultaneous genotyping of all the SNP on the panel make these chips more cost-effective than using micro-satellite markers, and much larger populations of up to 10,000 animals have been genotyped, although there are also many small studies with 1,000 or fewer individuals.
The current status of genomic approaches
Regressing phenotype or breeding value on QTL genotype would estimate the additive effect of a QTL. However, since the actual location of the QTL are unknown, nor are the QTL genotypes, this is not an option, but the regression of phenotype or breeding value on SNP marker genotypes can be calculated. A SNP in perfect LD with one QTL would show a steeper regression than other SNPs with less LD with that QTL. Such regressions could be undertaken on every SNP. In the human area, regressions are typically carried out one SNP at a time, from a hypothesis-testing framework. In livestock, our interest is not so much in finding significant SNP, but in accurately predicting merit from as many SNP as are required, regardless of whether or not they reach statistical significance.It is not possible to simultaneously fit more fixed SNP effects than there are observations. Stepwise least squares procedures could be used to progressively add the most informative SNP, to derive an informative subset. However, least squares approaches are known to overestimate effects, particularly when the overall power of the experiment is low. In contrast, methods that shrink estimates tend to be more reliable. Two methods of shrinking estimates are to fit random rather than fixed regressions, or to fit mixture models. Both these approaches are commonly used in genomic predictions.
If the QTL locations were known, along with the most informative SNP in those regions, then relationships between selection candidates and historical animals could be derived from these SNP in order to obtain accurate predictions of merit for the selection candidates without the phenotypic records. However, the QTL locations are not yet known, but could be assessed from the joint regression of performance on the SNP genotypes.
Regression of performance on all SNPs simultaneously can be achieved by fitting the effects as random. That requires knowledge of the variance ratio appropriate for each SNP effect. One option is to fit the same variance ratio for every SNP, which is known as ridge regression. That variance ratio could be estimated from the data by various means. Meuwissen et al. (2001) refer to this method as BLUP, whereas Fernando and Garrick (2009) refer to it in a Bayesian context as Bayes C0. Another option is to fit a different variance ratio for each SNP, allowing the estimates of some loci to be shrunk more than others. A Bayesian method for such an analysis was developed by Meuwissen et al. (2001) who called the method Bayes A. However, it is unlikely that every SNP would be in LD with a QTL, so a more appealing method might be one which allows some fraction of the loci to have zero effect. Meuwissen et al. (2001) developed such a method in the context of a mixture model, which they referred to as Bayes B. One problem with their method is that it required the mixture fraction (π) to be known. Kizilkaya et al. (2010) introduced the concept of a mixture model within the framework of ridge regression, describing that method as Bayes C. That method with π=0 is Bayes C0 or ridge regression. Fernando and Garrick (2009) further extended that method to simultaneously estimate the mixture fraction from the data, a method they refer to as Bayes Cπ.
The regressions tend to overfit the so-called training data used in the analysis; therefore quantifying the accuracy of the predictions cannot be done from that same analysis. Cross-validation where the training data is partitioned into subsets, one used for training and another used for validation is one method for quantifying the accuracy. Another alternative is to validate in an independent dataset.
Simulated data with a finite number of QTL has demonstrated that models like Bayes B that exploit the correct mixture fraction result in more reliable predictions than methods like Bayes A or Bayes C0 that fit very SNP. Further, estimating the mixture fraction from the data gives better genomic predictions than using an improper mixture fraction. Simulation studies have shown correlations between genomic predictions and underlying genotype of 0.7-0.9 (Meuwissen et al., 2001), accounting for 50-80% of total genetic variance. It is tempting to assume such predictions do not discriminate between parent average (PA) and Mendelian sampling (MS) and estimate both components equally well.
Early whole genome analyses of the North American Holstein population (VanRaden et al., 2009) reported the PA reliability (r²) of animals without records or offspring to average 0.19 across traits and the genomic prediction to improve on that value by a further 0.18 increase. In the international collaborative analysis of Brown Swiss performance, Jorjani and Zumbach (2010) compared the PA predictions from conventional evaluations vs. the genomic evaluations from 50k SNP panels with the subsequent performance of progeny tested daughters four years later. Those analyses also demonstrated an increase in reliability by 0.18. Some of that increase in predictive ability is likely due to improved prediction of PA. If we were to assume all of it was due to MS, and MS accounted for 50% of genetic variance, then it would seem that these genomic predictions are predicting up to 36% genetic variance.
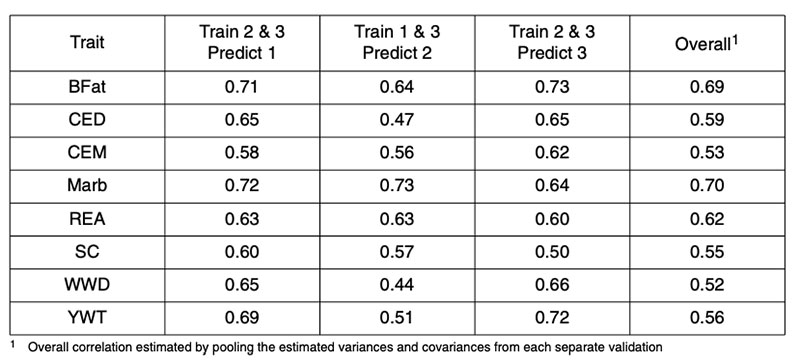
There are fewer published reports of genomic predictions in beef cattle. Analyses of US Angus bulls based on their published expected progeny differences (EPD) for a range of traits resulted in corre lations between two-thirds data used in training and one-third used for validation as in Table 1 (from Garrick, 2009). In that study, the AI bulls were randomly allocated to three subsets according to the sire of the bull, such that paternal half-sibs were not represented in more than one of the subsets. The pooled correlations between genomic and realized performance ranged from 0.5-0.7, accounting for 25-50% genetic variance.
Table 1: Correlations between 50k genomic prediction and realized performance for validation
of Angus sires in independent Angus datasets for backfat (BFat), calving ease direct
(CED) and maternal (CEM), carcass marbling (Marb), carcass ribeye area (REA),
scrotal circumference (SC), weaning weight direct (WWD) and yearling weight (YWT).
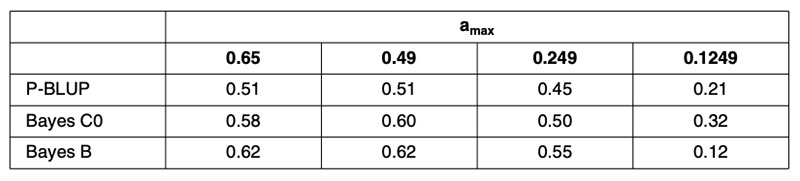
A recent publication by Habier et al. (2010a) partitioned the German Holstein population into ‘training sets’ in order to control the maximum pedigree-based additive genetic relationship between any bull in validation and all bulls in training. This partitioning was repeated in four scenarios to vary the level of relationship. Random partitioning resulted in additive relationships as high as 0.6 between training and validation bulls. Restricting the maximum relationship to 0.49 produced partitions that prevented parent-offspring relationships or splitting of full-sibs across training and validation subsets. Restricting the maximum relationship to 0.249 prevented grand-parental and half-sib relationships across training and validation subsets. A further scenario prevented maximum additive relationships from exceeding 0.1249. Creation of these scenarios required that some bulls be excluded from both the training and validation subsets. Interestingly, these scenarios had little impact on the average maximum relationship between training and validation subsets that remained at about 9% for the first three scenarios.
The results in terms of correlations are in Table 2, for predictions based on 1,048 training bulls using conventional pedigree analysis (P-BLUP), and for methods using genomic relationship matrices with equal (Bayes C0) or heterogeneous SNP weighting (Bayes B). Clearly the genomic predictions outperform pedigree-based methods, justifying their continued implementation, but the reduction in predictive power for the 0.1249 scenario is alarming for the use of genomic predictions for traits that are not routinely phenotyped every generation, as is envisioned for beef cattle traits associated with reproduction, feed intake, disease and eating quality.
Table 2. Correlations (ρ) between genomic predictions based on samples of 1,048 German
Holstein training bulls and observed performance in validation subsets with training
and validation animals partitioned to control the maximum additive relationship
(amax) between any validation bull and all training bulls.
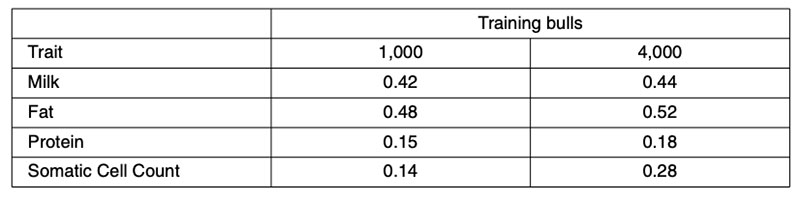
Further validation analyses have been undertaken using North American Holsteins for a small (1,000 bull) or large (4,000 bull) training set comprising animals born after 1994, validated in animals born before 1975 (Habier et al., 2010b). Those results (Table 3) fail to account for more than 0.52²=28% genetic variance. However, the validation bulls would have been assessed from progeny performance in management circumstances quite different from today, so both heterogeneous variance and genotype-environment interaction could have contributed to the reduction in predictive ability.
Table 3: Correlations between North American Holstein 50k genomic predictions from 1,000
or 4,000 training bulls born after 1994 and realized performance for ancestral bulls
born before 1975.
Validation of genomic predictions in other breeds provides a worst-case scenario in terms of predictive ability. Across-breed predictions could perform poorly because of dominance, epistasis, genotypeenvironment interactions, variation in LD among breeds, among other reasons. Training analyses based on North American milk yields from 8,512 Holstein bulls resulted in correlations of 0.194 in 742 Brown Swiss bulls and 0.198 in 1,915 Jersey bulls from Bayes A, and 0.141 in Brown Swiss and 0.244 in Jersey from Bayes B. Training in two of the three breeds and validating in the third resulted in correlations of 0.077 in Brown Swiss, 0.197 in Jerseys and 0.253 in Holsteins. Linkage cannot be contributing to these across-breed predictions, only LD, and that accounts for no more than 10% of genetic variance.
Any improvement on the accuracy of PA predictions provides opportunities for improved breeding schemes. These results clearly indicate that genomic techniques can increase predictive ability and therefore have an immediate role in breeding schemes. The performance of genomic predictions based on analysis of 4 generations of a Hy-line layer population are shown in Table 4, where validation was undertaken in generation 5, the offspring of generation 4 from the training population (Wolc et al., 2010).
Table 4. Validation of conventional pedigree evaluation (P-BLUP) and predicted genomic
breeding values used to estimate the merit of layer selection candidates at an early
or late selection stage based on their parent average (PA) genotypes or their own
individual genotypes for egg production (PD), egg weight (EW), shell quality (PS),
albumen height (AH), weight of first 3 eggs (E3), color of first 3 eggs (C3) and yolk
weight (YW).
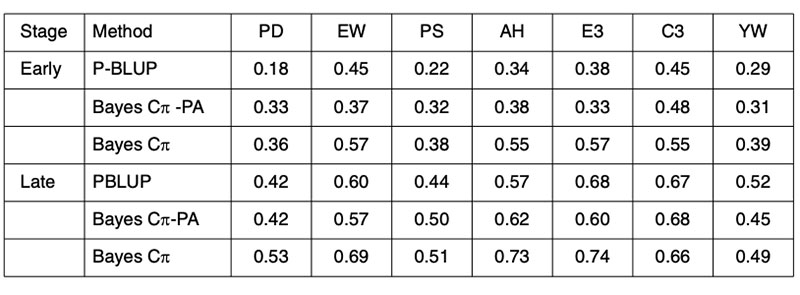
The early adoption of genomic prediction in livestock has not been to improve accuracy on previously difficult to predict traits, but to improve the accuracy at a young age of the easily predicted traits. Further, the predictive ability is most reliable in offspring of the training animals, implying that for the near future, each seedstock population must have its own training analyses for every trait and that phenotypic data will need to be continually collected in order to provide for ongoing training in successive generations.
Likely future directions
Enormous potential remains for increasing the predictive ability from genomic data to levels closer to that which can be obtained in simulated data. Research is urgently required to further investigate methods in which some of this potential might be exploited in the near term. This might involve the use of higher-density SNP panels (e.g. 500k or 1m SNPs), the use of haplotypes, and joint analysis that models both linkage and LD relationships. Further, the cost-effective use of this technology warrants the use of cheaper lower density panels for screening non-parents. One approach for using low-density panels would require genotypes of selection candidates for high-density markers to be imputed from high-density information on their parents and low-density information on the individuals (Habier et al., 2009). That approach has particular appeal in poultry breeding and is the subject of current research.Bulmer, M.G. (1971): The effect of selection on genetic variability. Am Nat, 105: 201-211.
Fernando, R.L. and D.J. Garrick (2009): GenSel – User manual for a portfolio of genomic selection related analyses. Animal Breeding and Genetics, Iowa State University, Ames. http://taurus.ansci.iastate.edu/gensel
Garrick, D. J. (2009): The nature and scope of some whole genome analyses in US beef cattle. Proceedings of the Beef Improvement Federation 41st Annual Res. Symp. April 30 – May 3, 2009. Sacramento, California, USA. 41:92-102.
Habier, D., R.L. Fernando and J.C.M. Dekkers (2009): Genomic selection using low-density marker panels. Genetics 182:343-353.
Habier, D., J. Tetens, F.-R. Seefried, P. Lichtner and G. Thaller (2010a): The impact of genetic relationship information on genomic breeding values in German Holstein cattle. Genet. Sel. Evol., 42:5.
Habier, D., R.L. Fernando, K. Kizilkaya and D.J. Garrick (2010b): Extension of the Bayesian alphabet for genomic selection. Proc. 9th World Congress on Genetics Applied to Livestock Production. In press.
Hazel, L.N. (1943): The genetic basis for constructing selection indexes. Genetics 28:476-490.
Jorjani, H. and B. Zumbach (2010): Preliminary results from validation tests. Interbull Workshop on the Use of Genomic Information in Genetic evaluations. Paris, March 4-5, 2010. In press.
Kizilkaya, K., R.L. Fernando and D.J. Garrick (2010): Genomic prediction of simulated multibreed and purebred performance using observed fifty thousand single nucleotide polymorphism genotypes. J. Anim. Sci. 88: 544-551. Meuwissen, T.H.E., B.J. Hayes and M.E. Goddard (2001): Prediction of total genetic value using genome-wide dense marker maps. Genetics 157: 1819-1829.
Spelman, R. J., W. Coppieters, L. Karim, J. A. M. van Arendonk and H. Bovenhuis (1996): Quantitative trait loci analysis for five milk production traits on chromosome six in the Dutch Holstein- Friesian population. Genetics 144: 1799-1808.
VanRaden, P. M., C.P. Van Tassell, G.R. Wiggans, T.S. Sonstegard, R.D. Schnabel, J.F. Taylor and F.S. Schenkel (2009): Invited review: Reliability of genomic predictions for North American Holstein bulls. J. Dairy Sci. 92:16-24.
Weller, J.L., Y. Kashi and M. Soller (1990): Power of daughter and granddaughter designs for determining linkage between marker loci and quantitative trait loci in dairy cattle. J. Dairy Sci. 73:2525-2537.
Wolc, A., C. Stricker, J. Arango, P. Settar, J. Fulton, N. O’Sullivan, D. Habier, R. Fernando, D.J. Garrick, S.J. Lamont and J.C.M. Dekkers (2010): Breeding value prediction for early production traits in layers using pedigree and marker based methods. Proceedings of the 9th World Congress on Genetics Applied to Livestock Production. In press.
Zusammenfassung
Revolutionäre Methoden genetischer LeistungssteigerungIn den vergangenen 50-100 Jahren wurden bei landwirtschaftlichen Nutztieren durch Selektion bemerkenswerte Leistungssteigerungen erzielt, allerdings mit Unterschieden zwischen Tierarten und der Bereitschaft, Gebrauch von neuen Erkenntnissen der Tierzuchtforschung zu machen. Die Basis züchterischer Verbesserung bleibt immer – die Auswahl überdurchschnittlicher Kandidaten als Eltern der nächsten Generation. In diesem Rahmen hat sich über die Jahre einiges geändert. Die Selektionswürdigkeit wird nicht mehr nach äußeren Kriterien beurteilt, sondern nach messbaren Abweichungen vom definierten Zuchtziel, häufig ausgedrückt in einem Selektionsindex, der alle wirtschaftlich wichtigen Kriterien in einer Zahl zusammenfasst. Rechentechnische Methoden, um Informationen korrelierter Merkmale von Verwandten zu einem möglichst genauen Gesamtzuchtwert