


Introduction
The production of poultry meat continues to expand in Germany as in most other countries. Apart from aquaculture, it is the only sector of the farm animal industry with significant growth rates. Per capita consumption of poultry meat was 18.6 kg in 2009, compared to 23.1 kg of the 27 EU countries and 48.8 kg in the USA. While the total demand for poultry meat is predicted to increase in the foreseeable future, producers need to study local limitations and opportunities to benefit from this market. In this context, it is of interest to compare the production cost and margins for different poultry species. The expansion during the past decade has been essentially due to increased broiler production, whereas turkey meat and duck meat consumption appear to have reached limits near 6.0 and 1.0 kg respectively.The increased broiler meat consumption has been supported by simultaneous expansion of processing facilities, resulting in self-sufficiency, whereas turkeys and Pekin ducks could satisfy only 76 and 86.5% of the domestic demand (Beck, 2010). Farmers interested in poultry meat production now have to decide whether to invest in broiler production for export or other poultry for the domestic market.
In this study, we will use statistical data from the German Extension Service (Damme, 2010) to address the following questions:
• How much area, capital and labor are required for growing broilers, turkeys and Pekin ducks to market weight?
• Which margins can be expected from growing different species of poultry?
• How do the profitability and income per working hour compare between species?
• Which bird capacity and capital investment is required to generate an acceptable family income?
Assumptions for comparative study
In order to develop comparable results, it was assumed that a family farm would produce 600 t live poultry annually. For broilers, this would be an all-in, all-out growing capacity for 40,000 unsexed chicks, grown to 2 kg final weight; placements every 7 weeks i.e. 7.5 time per year. To produce 600 t live turkeys, 14,300 poults would be placed 2.8 times per year in a rearing unit for the first 5 weeks, at which time the sexes would be separated and the males moved to the second unit with sufficient space for an extended growing period. To produce 600 t of live ducks, 14,800 Pekin ducklings would be placed in a warm rearing unit for the first 18 days, then moved to a finishing unit to reach 3 kg at 40 days of age; day-old placements about every 4 weeks or 13.5 times annually. Details are shown in table 1.Table 2: Capital, area and work requirements (output of 600 t LG)
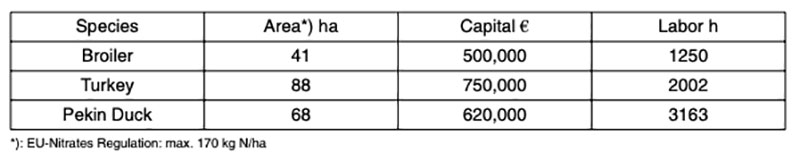
Capital requirement for annual production of 600 t live weight is lowest for broilers, 50% higher for turkeys and in between for fattening ducks. These differences are mainly due to the different live weights produced annually per square meter house capacity: 293 kg broilers, 194 kg ducks and 154 kg turkeys. In other words, the same live mass of broilers can be grown on 34% and 45% less housing area than Pekin ducks or turkeys.
Differences in labor requirement for housing, daily care, moving to another unit, depopulation and cleaning between flocks are also significant: 25 min/100 broilers (Joos et al., 1999), 300 min/100 turkeys (Janning, 1996) and 95 min/100 Pekin ducks. Turkeys and especially Peking ducks require regular attention to check litter quality and add dry litter as necessary. For ducks, two persons will be needed for this job. Peak labor requirements and need for hired help also should be considered. Labor peaks depend on the frequency of housing. In this respect, turkeys have an advantage over broilers and especially ducks with their frequent placements (Tischler et al., 2008).
Margins and contributions to farm income for different meat type poultry
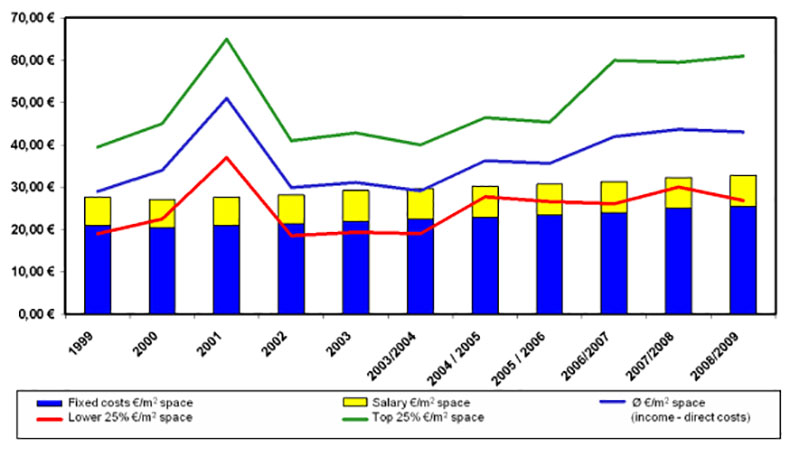
The figures used to calculate margins (DB) and income per farm are taken from published reports of the Working Group Broilers of the Agriculture Department Hannover, the Working Group Turkeys in North Rhine-Westphalia, and the Working Group Pekin Ducks in Lower Saxony and Southern Germany (Damme, 2010).The figures are based on a large and thus representative volume of field data: 10 years, each year with 400 to 450 batches on 55 to 60 farms for broilers; 8 years with 50 to 60 batches on 27 to 30 farms for turkeys; and 4 years with about 120 batches from 12 farms for Pekin ducks. Figure 1 shows the average annual margins and the upper and lower quartile of all broiler batches for the years 1999 to 2009. The fixed capital cost for interest and depreciation of housing and equipment increased from 20 to 25 EUR per square meter during this 10-year period; labor cost was assumed constant at 8 EUR per square meter and year. With the exception of 2003/04, the average margin for all broiler farms was always positive, with a modest average annual return of 6.75 EUR per square meter.
The difference between the upper and lower quartile is obvious, and it appears that the spread between the 25% most successful and the 25% least successful batches even increased in recent years. These differences include a range of possible effects, including chick quality, management skill, house temperature and humidity during different seasons, feed quality, and disease control.
Figure 1: Average farm income and cost per m2 space for broiler growers during the years
1999 – 2009
As shown in figure 2, the economic results were less favorable for turkey growers. Fixed costs and labor costs increased from 30 to 33 EUR per square meter for new houses, and average margins were positive in only three out of eight years. Between 2002 and 2006, the income per working hour was less than 15 EUR, and many farmers could barely earn the depreciation. Only the top 25% of all batches produced 5 to 34 EUR income over capital and labor cost during the years 2002 to 2009.
Figure 2: Average farm income and production cost per m² for turkey growers during the
years 2002 – 2009
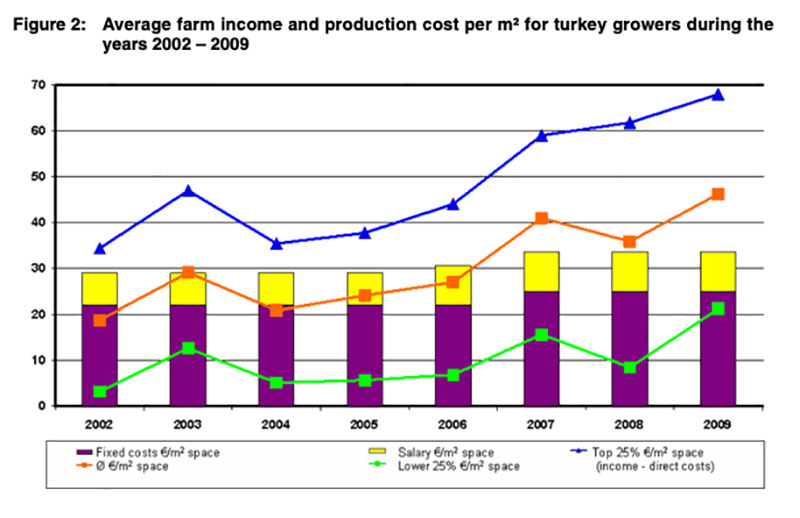
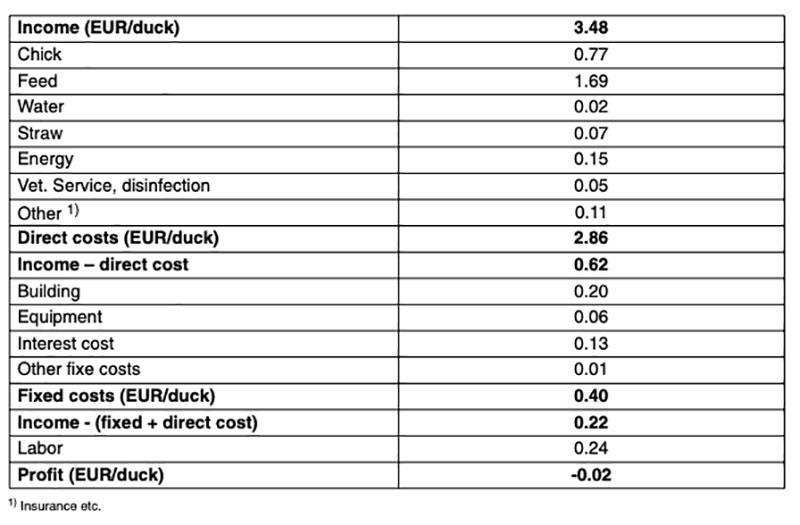
Table 3 shows details of the income and cost calculation for Pekin ducks, based on data from the producers’ cooperative in Southern Germany. During the 4-year period from 2006 to 2009, the income minus fixed and variable cost was 0.22 EUR per duck, which would not cover the assumed labor cost of 15 EUR, i.e. actual income per working hour was 13.75 EUR.
Table 3: Cost and margin analysis Pekin duck (Süddeutsche EG 2006/2009)
Necessary size of operation to generate a family income of 50,000 EUR
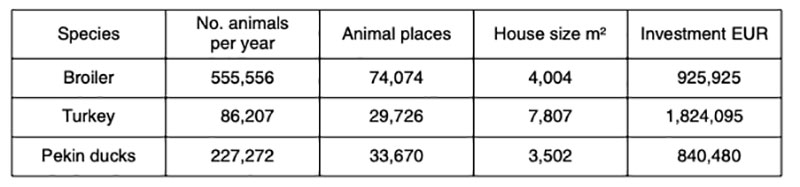
To generate a similar income as people with comparable education working in the industry, a young farmer may ask: what size of operation would I need to earn 50,000 EUR annually as broiler, turkey or duck grower? Based on the production cost and margins shown in figures 1 and 2 and the figures summarized in tables 4 and 5, the capacities shown in table 6 would be required: 74,000 broilers or 30,000 turkeys or 34,000 Pekin ducks. In other words, a family farm would need to grow more than half a million broilers, 227,000 Pekin ducks, or at least 86,000 heavy turkeys per year to earn an income of 50,000 EUR. Assuming that new facilities are built, bank credits close to 1 million EUR would be needed for broiler or Pekin duck growing, 1.8 million EUR for growing heavy turkeys.Table 4: Production costs per animal and per kg live weight in ct. (Geflügeljahrbuch 2010)
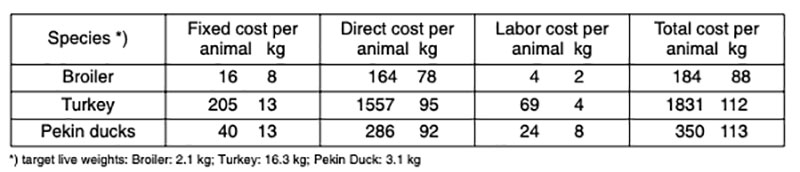
Table 5: Actual economic results of poultry meat production with different poultry species;
statistics from extension service
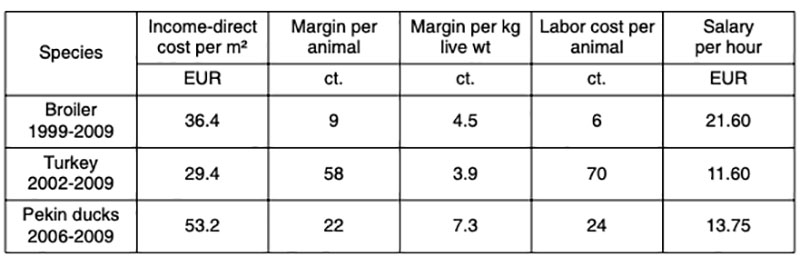
Table 6: Animal places and capital requirements to realize a farmer income of 50,000 EUR per
year
Summary and Conclusions
The comparison of poultry meat production from broilers, turkeys and Pekin ducks under economic conditions in Germany suggests significant advantages for broilers compared to the other species in terms of required arable land, total margin and earning per working hour. Further investment in broiler growing capacity appears justified if domestic consumption continues to grow and/or the production cost remains competitive with other EU countries. To support 1 kg higher per capita domestic consumption would require e.g. 190 new units with a capacity of 40,000 birds.The economic situation for turkey growers recovered during the last three years, after a very difficult period of adjustment to overcapacity and losses due to blackhead disease breaks. In view of the higher capital cost it is unlikely that many farms will want to start with this business, but successful farms may decide to expand existing facilities, change to a shorter cycle to reduce the fixed cost or venture into the niche market for organic turkey meat, possibly in connection with the production of bioenergy, as long as politics provides such incentives. Peking ducks offer the chance to maximize the return per square meter growing space, but many working hours are required. The robustness of Pekin ducks and lower disease risk make duck growing attractive for farms starting with poultry meat production. However, the market potential is still subject to seasonal demand, and unless consumption becomes more uniform throughout the year, the assumptions underlying the present study will not fully materialize in practice.
To be successful in any one of the three alternative types of poultry meat production, it will be necessary to study the market potential before the investment, to learn the basics from other successful farms and to plan on a long-term learning process to find an attractive position in the upper quartile of all farms.
Acknowledgement
The author thanks the Editor Prof. D.K. Flock for the translation of the manuscript, which was submitted in German, based on a paper presented at the annual meeting of the German WPSA Branch in 2010.References
Beck, M.M. (2010): Versorgungsbilanz Geflügelfleisch. In: Marktinfo Eier und Geflügel. Eugen Ulmer KG Stuttgart, ISBN 978-3-8001-7534-5.Damme, K. (2010): Faustzahlen zur Betriebswirtschaft. In: Geflügeljahrbuch 2011, Eugen Ulmer KG, Stuttgart; ISBN 978- 3-8001-6988-7
Janning, T. (1996): Arbeitswirtschaftliche Beurteilung der Mastputen, KTBL Schrift 374, Landwirtschaftsverlag Münster, Hiltrup.
Joos, B., J. Beck., T. Jungbluth (1999): Geringer Arbeitszeitbedarf in der Junggeflügelmast. DGS Magazin 48, 18-24.
Tischler A., K. Damme, S. Graser (2008): Perspektiven der integrierten Hähnchen-, Puten – und Pekingentenproduktion in Bayern. Heft Nr. 13 der Schriftenreihe der LfL ISSN 1611-4159.