


Crop based bio-energy can be an important and increasing factor for the energy supply, if the agricultural sector is able to provide mass-produced energy crops. One relevant factor presently limiting the development of bio-energy systems based on energy crops is the availability of land for biomass production. Land availability for energy crop production depends on the overall amount of available agricultural land and the demand of land for food and feed production. The method of estimation of the potential is shown by Thrän et al. (2006) and Henze and Zeddies (2007). The results are derived from statistics of FAOSTAT, EUROSTAT and FAO and will be shown for selected countries and on global scale for continents.
Drivers for the future food and feed demand
There are various drivers which influence the actual and future food and feed demand. In the following overview, I will address the following main factors:- Development of the global human population
- Per-Capita consumption of food (global per-capita consumption is changing slowly but at an increasing rate; production of animal products needs more acreage than production of plant products)
- Increase of yields of specific plant products due to progress in plant breeding, farming technology and assimilation of production systems (in Africa and Asia)
- Climate changes influencing the availability of arable land and the potential for crop production
- Loss of agricultural acreage by soil degradation (erosion, salinisation) and additional need of areas for non-agricultural purposes
- Competing needs for nature conservation and for flood protection
- Extensification to protect the environment
- Use of arable land for the production of raw material for the industry
- Use for attractive non subsidized exports
The main factors are the development of the global population and future per-capita consumption – driven by (1) developments of the world wide economic growth and resulting purchasing power and (2) developments of plant yields for food, feed and biomass production.
Important, but difficult to predict with sufficient accuracy, will be climate changes and their influence on agriculture.
Development of food consumption
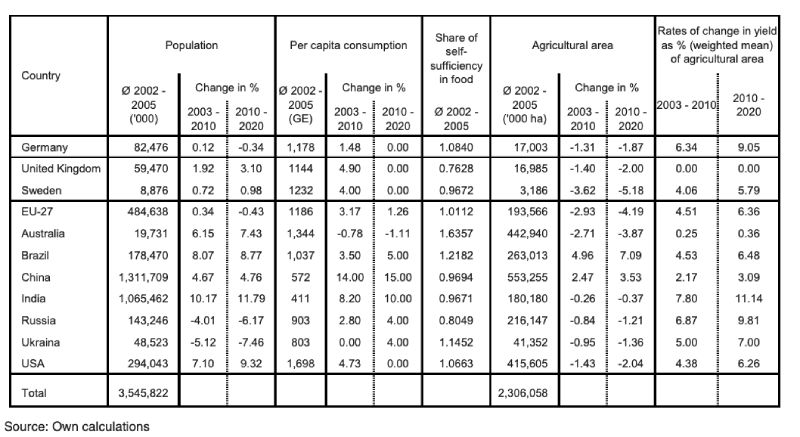
The main variables determining the potential for food and non-food production are shown in Figure 1 and Table 1: population, per-capita consumption, self-sufficiency, area utilized for agriculture and crop yield. Self-sufficiency was calculated from the self-sufficiency portion of the most important food items, weighted by their proportion of the entire food consumption in grain units.Food consumption is primarily determined by the development of a country’s population. In Germany and most of the EU-27 member countries, the population is constant or slightly decreasing, in the transformation countries Ukraine and Russia the decline is significant. On the other hand, continued strong population growth is anticipated in Asia, America, Africa and Australia (Figure 1 and Table 1)
Figure 1 Expected population development 2003-2020 (%)
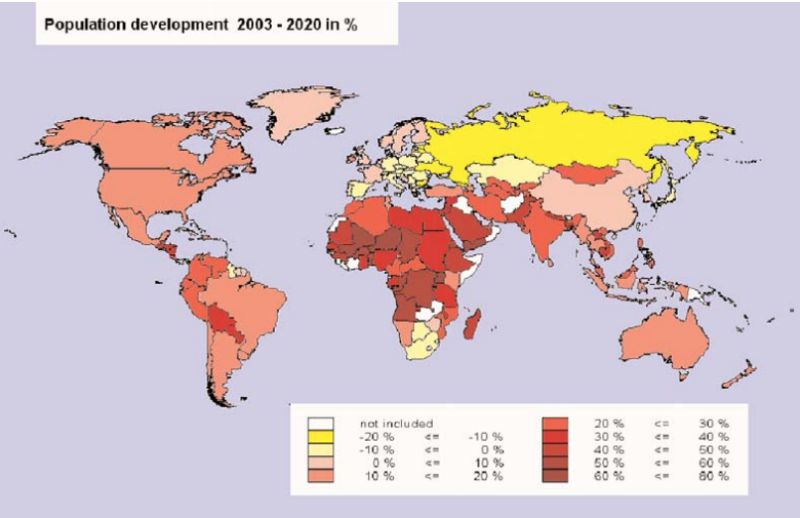
Table 1 Trends for key variables in selected countries
Per capita consumption is expected to change at different rates in different countries, increasing at above average rates especially in China and India (Figure 2, Table 2). A somewhat slower increase of about 5% is expected for Brazil. Continuing population growth and increasing per-capita consumption is expected for the USA until 2010, primarily due to high energy consumption for beef production. A small increase in per capita consumption is predicted for the EU-27 member countries, while stagnating per capita consumption is expected for Australia and rising per capita consumption in Russia and the Ukraine.
Figure 2 Development of per-capita consumption 2003-2020 (%)
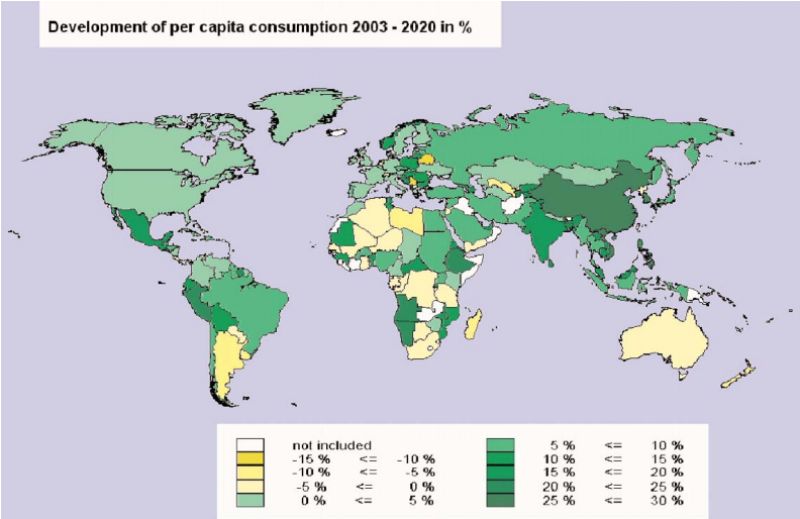
Table 2 Development of the global food demand and population until 2020
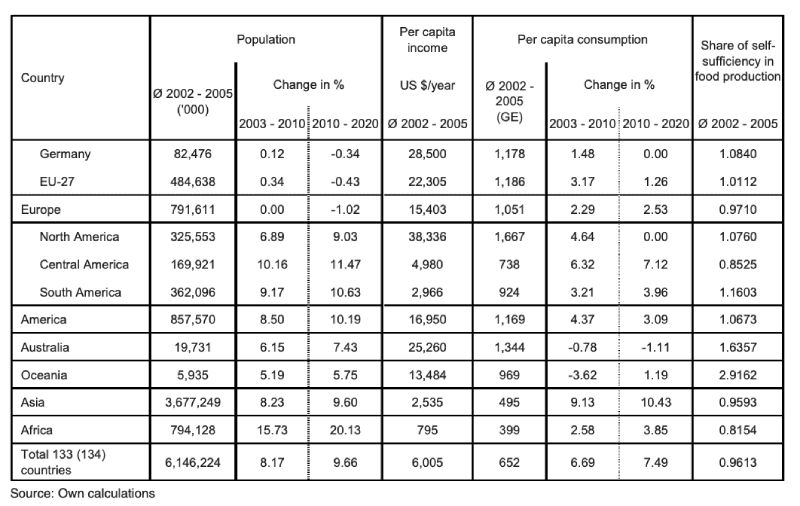
Self-sufficiency for food differs considerably between individual countries. The EU-271, China, India and the USA are close to self-sufficiency, while Brazil with its huge agricultural potential can export 20% of its production and Australia has even 160% self-sufficiency. Russia on the other hand depends strongly on imports, with about 80% self-sufficiency. The global situation and predicted developments are shown in Table 2.
Development of supply
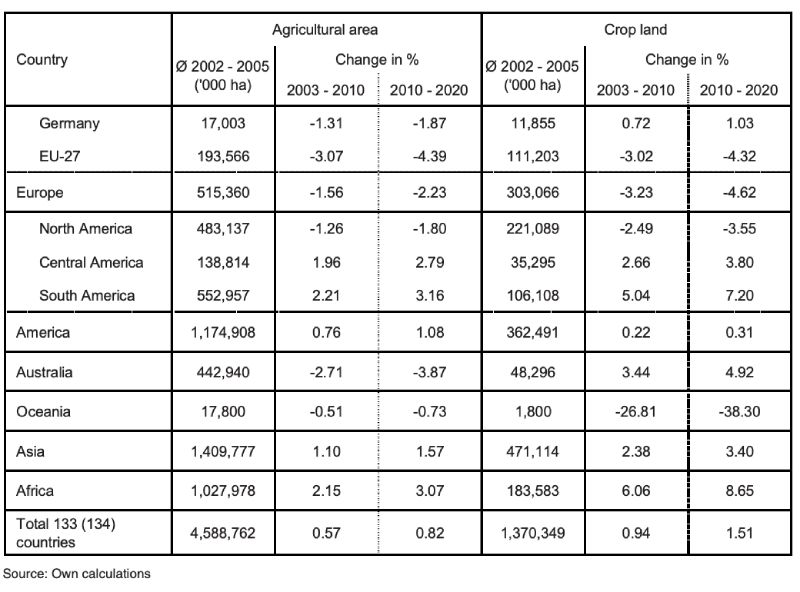
The figures for agriculturally utilised area in different countries (Table 1) are based on the FAO statistics 1991 – 2005. The agriculturally utilised area is decreasing in industrial countries like Australia, USA, Russia and the EU, but increasing in threshold countries like Brazil and China due to increased utilisation of land for agriculture and to some extent deforestation. This trend is expected to continue in the coming years until 2020. Global changes in climate have not been taken into consideration, but they may lead to gains in arable areas e.g. in Northern Europe and/or losses in other areas e.g. in sub-Sahara countries of Africa. These effects have to monitored, but no hard figures will be available before 2020. Figures for continents are shown in Table 3.Table 3 Global agricultural area and crop land until 2020
The assumptions regarding future development of yield are of cardinal importance for the prediction of potential production (Table 4). Estimates are derived from linear regression coefficients calculated for the period 1994 – 20052 for the relevant cultivars (grain, oil crops, root crops, sugar cane and sugar beet, starchy root crops and agricultural feed crops (e.g. corn silage). For strongly deviating trends within time series, rates of change were based on “educated guesses”.
Table 4 Global area for cereal production and yield development until 2020
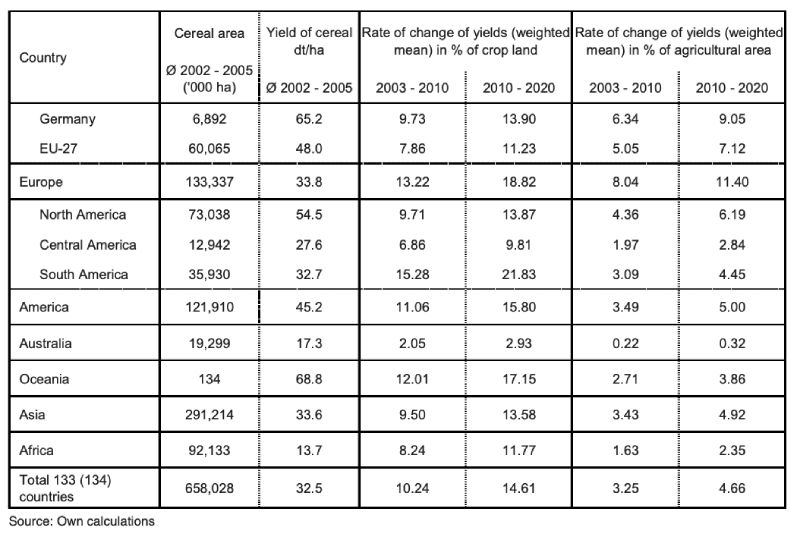
In the countries dominating the world trade with agricultural products, i.e. Brazil, the USA, the EU-27 with large agricultural area states like France, Germany and Poland, yields are characterized by sustained significant increases. Noteworthy increases in yield were achieved in the past, even in the most densely populated countries of the world, China and India, and further increases in yield can be expected. In Russia and the Ukraine yields decreased initially after the political changes in the early 1990s and are still at a low level compared to the potential of soil and climate.
For areas with specific and apparently increasing drought, like Australia, yield increases were negative. They are quite frequently ascribed to the results of climatic change in this respect. Changes in climate will not only result in increased limitation of growth in yield as a result of temperature increases and rainfall deficits in arid areas, but also in growth impulses due to higher CO2-concentrations and increased temperatures in other areas. However, these effects appear to be limited and insignificant until 2020.
Land availability for non-food
Land availability for bio-energy or export is a result of development of demand and supply of food. Surpluses can be used for other purposes. The available land is shown for selected major countries (Table 5) and for continents (Table 6).Table 5 Potential of agricultural land for bio-energy production for selected countries
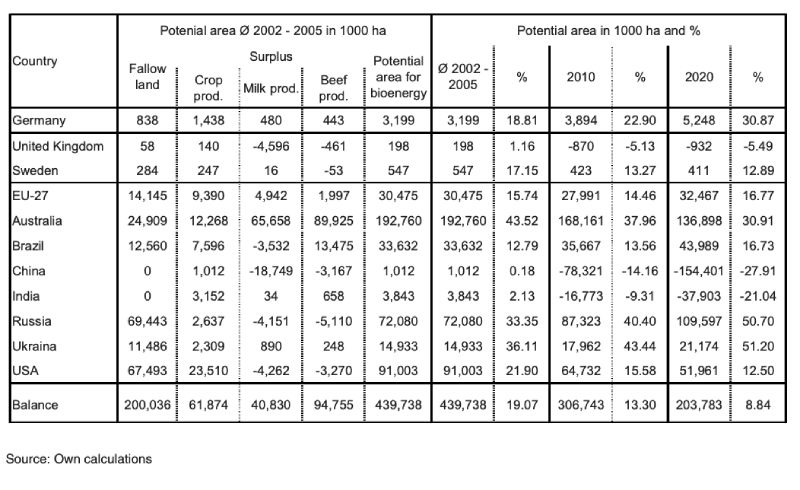
In Europe (EU-27), at least 30 million ha of land were available in 2002-2005 for bio-energy sources. Assuming increasing progress in yield, up to twice as much could be available in 2020. Essentially no additional contribution is expected from grassland, yields on grazing land are expected to remain unchanged.
Besides the USA, Australia is one of the countries with the highest grain export surplus. With more than 440 million ha of agriculturally utilized area, more than 20 ha of agricultural area is available per capita. However, a strong negative trend has been observed in recent years3. If this trend continues, the significant potential for bio-energy available in 2003 (almost 193 million ha), will drop to 137 million ha in 2020, because strong population growth coincides with a reduction in agriculturally utilised land area and yield per ha.
The USA has an agriculturally utilized area comparable to the size of Australia, but only 1.4 ha of agriculturally usable land per capita. Significant increases in yield per ha have been achieved and are expected in the future, based on cultivation of high yield maize varieties; utilization of genetically modified cultivars is expected to play a major role here. With an area of 91 million ha (beyond supply for the own population), the USA not only has a huge production potential based on higher average yields, but can also add to this potential from fallow areas, intensified irrigation and dual-crop production. However, all scenarios point to a decreasing area potential for bio-energy in the USA over time.
Brazil is currently one of the main exporters of agricultural products and at the same a major exporter of bio-ethanol world-wide. The agriculturally utilised area has been expanded significantly during the past ten years, and at the same time average yield has increased at a faster rate than in the EU-27 and the USA. The area available for bio-energy is expected to increase only slowly from currently 33 million ha until 2010, but stronger after 2010 to reach 44 million ha in 2020 (while retaining the currently high proportion of utilising agricultural raw materials for bio-energy, especially bio-ethanol).
China can currently provide enough food for itself, but only about 0.4 ha agriculturally used area is available per capita, and this number is decreasing rapidly. On the other hand, China has been able to increase yield even more than highly developed industrial countries and is expected to continue this trend until 2020. Only about 1 million ha are available for bio-energy cultivation. Domestically produced dairy products and beef are short in supply and are being imported. If the additionally required foodstuffs for 2010 are produced domestically, which is assumed in our estimates, there will be a shortage of 78 million ha in 2010 and 154 million ha in 2020.
This area requirement is calculated on the basis of the less productive grasslands in the north and west of the country. However, China will not be able to satisfy the growing demand for dairy products and beef by utilizing only these areas, but will use high yield alfalfa and maize, thereby reducing the required area below the highly over-estimated figures shown in the table. Obviously major political efforts will be necessary to counteract the current trend of increasing imports of foodstuffs.
India has only 0.17 ha of area per capita. This area is utilised intensively by multiple crops and a significant increase in output has already been achieved by increased cultivar yields and an acceleration of the cropping index. The trends indicate that imports of foodstuffs will increase to feed the growing population, unless efforts to retain self-sufficiency from own resources are successful. Without a reversal of current trends, a deficit of 38 million ha of area potential is predicted for 2020.
Russia has of a huge agriculturally usable area of 216 million ha, about 1.5 ha per capita. The level of productivity was still quite low for 2002 – 2005, following a sharp decline after the transformation period in the 1990s, but a positive trend is seen in recent years. Russia possesses a significant area potential to increase the production of foodstuffs, mainly fallow areas which are currently not being utilised. Starting from an extremely low level, production will probably increase significantly more than reflected by the regression analysis during a period of profound political changes. The renovation of agricultural technology which started a few years ago will certainly have its effects on output. In the medium term Russian agriculture may also benefit significantly from the predicted global warming. With increasing agricultural prices, an area potential of more than 100 million ha can be made available for the generation of bio-energy or for export of food.
Statistics for the Ukraine reflect similar trends due to the transformation process as for Russia. The Ukraine is a country with agricultural surplus, but (contrary to Russia) it has not yet started to increase productivity by modernizing agricultural technology. Growing area and production potential can result in comparable orders of magnitude as in Russia. It is unlikely that past trends of decreasing per-capita consumption and yield per ha will continue. Our estimates indicate a growth potential for bio-energy of about 20 million ha.
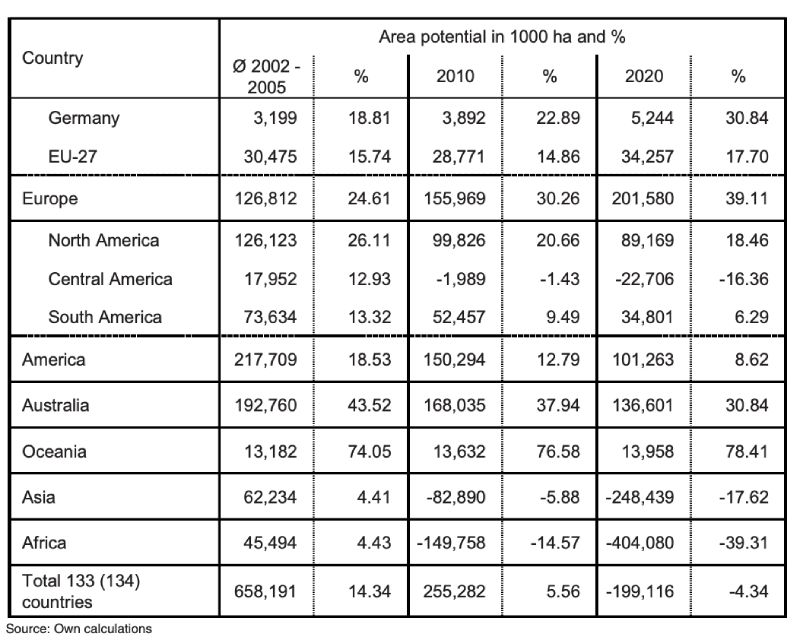
Adding up the area potential per continent shows that the global potential for agricultural surpluses or bio-energy will decrease from almost 660 million ha in the base years 2002-05 to 255 million ha by 2010 and a deficit of 200 million ha in 2020, mainly due to an increase in the demand for food. It is calculated that Asia has a deficit of 250 million ha, Africa a deficit of 400 million ha to reach selfsufficiency in food production, without any reserves for bio-energy.
We have only estimated the area potential, not the production potential. The analysis shows, however, that the potential for food production for export is decreasing. Of all countries included in our study, only the EU-27, Brazil, Russia, the Ukraine, Argentina and Canada show a potential to increase the area of land used for agriculture. The USA and Australia will lose significant shares in the world market for agricultural products.
Table 6 Global potential of land for bio-energy
Export-/Import balances and external trade of agricultural commodities
Based on estimated availability of area for non-food, the export-import changes to be expected in future can be calculated, subject to the assumption of an unchanged cultivation situation and taking into consideration the trends of domestic consumption as well as trends of domestic supply. In the EU, an above average growth is experienced. In Table 7 and Table 8 the import/export balances of the selected countries and the continents are listed.If we assume that the countries in question will not expand bio-energy production and use additional output (from fallow areas and yield increase) only to increase export of food and feed, then grain surplus in the EU-27 for export could increase by 19 million t to about 78 million t in 2020. At the same time current oil seed imports of 20 million t could remain virtually unchanged, while the import gap for plant oils would increase slightly.
The agricultural surplus countries Australia and USA would in future be able to offer increasing export volumes of grain on the world market. Brazil would also be able to increase its export surplus for grain. Even China and India would exceed their requirement for foodstuffs substantially. However, they would not appear as exporters on the world market, because they will have huge deficits of oils, vegetables, etc. They will utilise excess grain areas for vegetables and feeds. Russia and Ukraine have significant production reserves, which can be added to the global grain market.
Overall, this results in a significant increase in export volumes for the provision of grain of these important agricultural production and foodstuff consumer countries. The EU, and increasingly China, will appear on the world market as importers of oil seeds, followed by India, with an increasing net import demand.
Table 7 Export-/Import balance of various countries
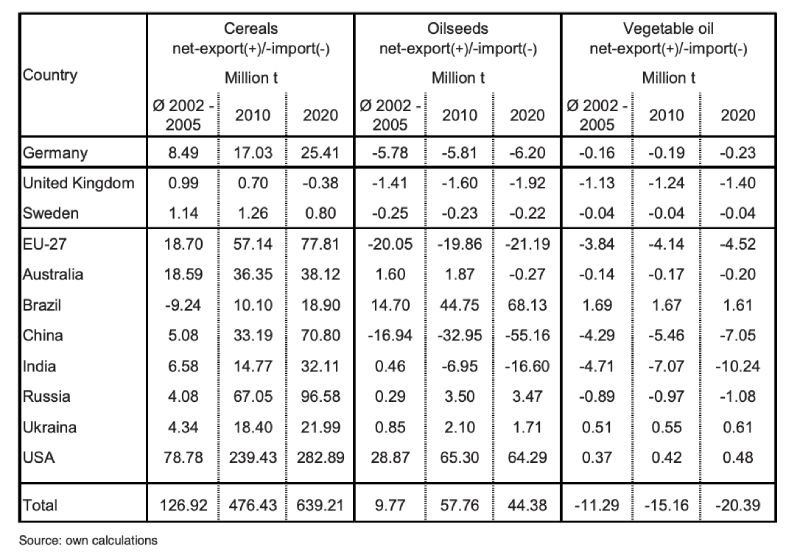
Table 8 Export-/Import balances of the continents
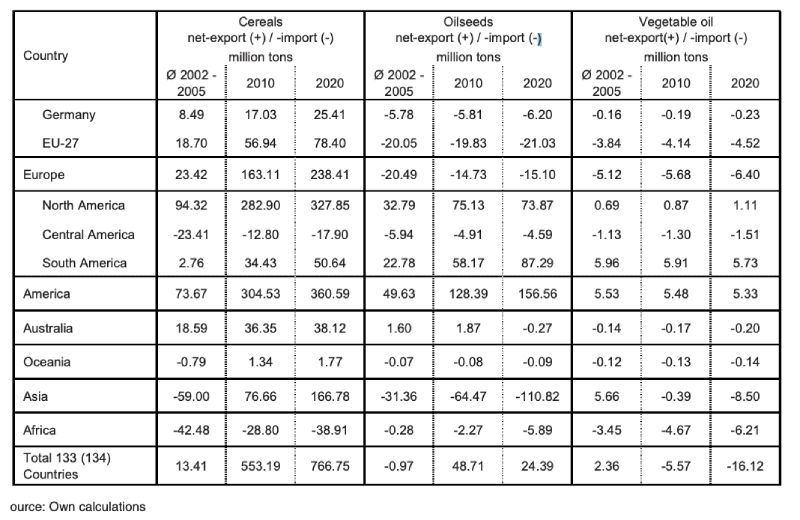
On the other hand growing production volumes, especially of soy beans in Brazil and the USA, will lead to a growing export surplus for these countries. The demand for oil seeds for foodstuffs can be covered, provided national promotion of bio-diesel production from oil seeds (as in the EU, the USA and Brazil) does not counteract this. An increasing import deficit emerges for plant oils, which have previously been made available for export by a few tropical countries, i.e. Malaysia and Indonesia. This deficit could be compensated at least partially by international trade of surplus oil seeds.
Conclusions
The availability of potential bio-energy sources can be estimated by different approaches. Theoretical and technical potentials must take into consideration the use of plant products in competition with demand for food and feed, nature conservation and other demands on limited area. Prognoses of economical potential require realistic estimates of future prices for agricultural raw materials, energy sources and statistical models which simultaneously take the competition between alternative land usage incentives to invest in new facilities into account. This can only be attempted for individual countries with complex models, but not for larger economic areas, like the EU-27 or the entire world. Although this study is based on simplified assumptions to establish the “exploitable area potentials”, the results and conclusions should be useful for political decision makers and all those who have to plan ahead.Taking into consideration fallow land and yield improvements, the results show that substantial agricultural potentials could be utilised before acute price reactions and provision dependencies will arise for food and feeds.
A huge potential for bio-mass production as source of renewable energy exists in the EU-27, selected major countries and on all continents. However, the question is still open to what extent bio-mass can be utilised for bio-energy production in competition with adequate nutrition of a growing world population.
Thrän, D., M. Weber, A. Scheuermann, N. Fröhlich, J. Zeddies, A. Henze, C. Thoroe, J. Schweinle, U. Fritsche, W. Jenseit, L. Rausch, K. Schmidt (2006): Sustainable Strategies for Biomass Use in the European Context. Herausgeber: Institut für Energetik und Umwelt GmbH, Leipzig, ISSN 1862-8060, http://www.ieleipzig.de/Biomassenutzung/downloads.htm
EUROSTAT Datenbank NewCronos: Landwirtschaftliche Erzeugnisse – Versorgungsbilanzen – Weinbilanz (Wirtschaftsjahr). Verwendbare Erzeugung 2000, 01.04.2004.
FAOSTAT: Agricultural data, Crops primary. http://faostat.fao.org/faostat/form?collection=Prodution.Crops.Primary&Domain=Production&servlet=1&hasbulk=0&version=e xt&language=EN, 30.04.2004.
FAO Statistics Division 2007. Website: http://faostat.fao.org Link: http://faostat.fao.org/site/377/DesktopDefault.aspx?PageID=377. 13 Juni 2007.
Henze, A. & J. Zeddies (2007): Flächenpotenziale für die Erzeugung von Energiepflanzen der Landwirtschaft der Europäischen Union. In: Agrarwirtschaft 56, Heft 5/6.
Zusammenfassung
Globale Potenziale der Energiegewinnung aus erneuerbaren RessourcenWährend die letzten zwei Jahrzehnte der globalen landwirtschaftlichen Entwicklung von strukturellen Überschüssen bei fast allen Agrarrohstoffen für Nahrungsmittel gekennzeichnet waren, stellt sich die Frage, ob die Ressourcen der Agrarwirtschaft in Zukunft ausreichen, um die kräftig steigende Nachfrage nach Nahrungsmitteln zu decken und darüber hinaus Biomasse für Energieträger bereitzustellen. Im vorliegenden Beitrag wird die Nahrungsmittelnachfrage nach ausgewählten für die Welternährung wichtigen Ländern und für alle Kontinente bis zum Jahr 2020 abgeschätzt und der Angebotsentwicklung für agrarische Rohstoffe gegenüber gestellt. Aus den Entwicklungen beider lassen sich Potenziale für Bioenergie für Länder und global grob voraussagen. Während der Anteil der Weltagrarproduktion für die Verwendung für Bioenergie im Jahr 2007 noch unter 4 % lag, steigt dieser Anteil in den nächsten Jahren kräftig an. Gleichzeitig ist seit einigen Jahren die Nahrungsmittelnachfrage weltweit unerwartet kräftig gestiegen und das Angebot an Agrarprodukten und die Politik haben darauf nicht oder
nur zögerlich reagiert. Die Bilanzierung der Wachstumsraten der Nachfrage- und Angebotsentwicklung agrarischer Rohstoffe weltweit und in wichtigen Regionen der Erde ergibt ein unterschiedliches Bild. Deutschland hat schon in den letzten Jahren ein beträchtliches Flächenpotenzial (ca. 3 Mio. ha) für Nahrungsmittelexporte und Bioenergieproduktion verwendet. Dieses wird bei stagnierender Bevölkerung und weitgehend unverändertem Pro-Kopf-Verbrauch durch zunehmende Erträge auf etwa 5 Mio. ha im Jahr 2020 ansteigen. Nach Aussetzung der Flächenstilllegung wird die EU-27 im Jahr 2020 über ein Flächenpotenzial von ca. 30 Mio. ha verfügen, das nicht für die inländische Nahrungsmittelversorgung benötigt wird. Große Zuschussgebiete für Nahrungsmittel und/oder Agrarrohstoffe entstehen in Asien und Afrika. Dadurch werden die Agrarrohstoffe bis zum Jahr 2020 deutlich knapper und die noch verfügbaren Produktionsreserven für die Deckung der Nahrungsmittelnachfrage bis dahin fast