Introduction
Between 1990 and 2009, global poultry meat production increased by over 50 mill. t or 123 %. No other agricultural product reached such a remarkable relative growth rate. The growth was not homogeneous, however, the highest absolute increase can be found in Asia with 21 mill. t , followed by South and Central America with 12.3 mill. t and North America with 10.5 mill t. In Europe, the absolute increase was much smaller with only 4 mill. t. In the same time period poultry meat production in the EU (27) grew by 4 mill. t or 50.9 %. The contribution of European countries to the global production volume decreased from 28.7 % in 1990 to only 17.2 % in 2009.In 2008, the traded volume of poultry meat was more than five times higher than in 1990 and reached almost 14 mill. t. The share of North American, South and Central American as well as European countries in poultry meat exports was almost equal, with North America in a leading position. In poultry meat imports, European and Asian countries shared almost the same volume. Together, countries in these two continents imported almost 81 % of all poultry meat that reached the world market. EU (27) member countries exported 2.9 mill. t of poultry meat in 2008 and imported 2.3 mill. t. When canned meat and preparations are included, the export volume even reached 3.8 mill. t. The main goals of this paper are:
• to give an overview about the development of global and EU poultry meat production between 1990 and 2009 by meat type,
• to identify the leading countries in production,
• to characterize changing patterns of poultry meat trade between 1990 and 2008 by regions and meat type,
• to identify the leading countries in poultry meat exports and imports by meat type.
Development of global poultry meat production between 1990 and 2009
Global poultry meat production increased from almost 41 mill. t in 1990 to 91.3 mill. t in 2009 or by 123 %. As can be seen from the data in table 1, the production volume of chicken meat grew by over 44 mill. t. Chicken meat contributed 87.8 % to the absolute growth, turkey meat 3.2 %, duck meat 5.2 %, goose and guinea fowl meat 3.7 % and other poultry meat 0.1 %. Chicken meat contributed 87.2 % to the overall poultry meat production in 2009, followed by turkey meat (5.8 %) and duck meat (4.2 %).Table 1: The development of global poultry meat production by meat type between 1990
and 2009; data in 1,000 t (Source: FAO database)

Table 2: Development of global poultry meat production between 1990 and 2009 by
continents; data in 1,000 t (Source: FAO database)
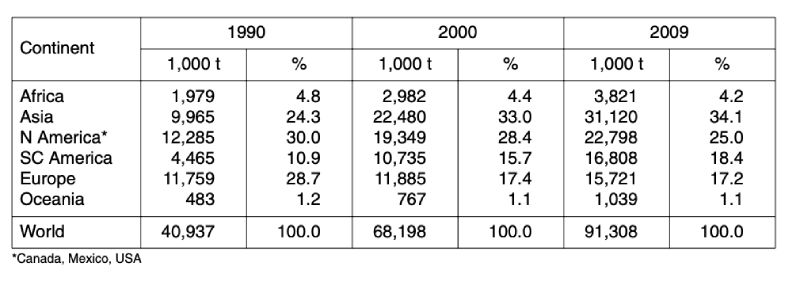
Table 2 reveals the remarkable regional shift that occurred parallel to the absolute and relative growth rates. Whereas European countries lost 11.5 % of their former contribution to global poultry meat production in the analysed time period, the share of Asian countries grew by 9.1 % and that of South and Central American countries by 7.5 %. North America, which was in leading position in 1990 with a share of 30 %, lost 5 % and only ranked second behind Asia.
A closer look at the development of the two leading meat types shows (tables 3 and 4) that in chicken meat production Asian countries ranked only on third place behind North American and European countries in 1990. Because of the dynamic development in Asia and South and Central America, Europe only ranked as number four in 2009 with 16.8 %. In turkey meat production, the regional shift was less dramatic. North American countries are still in an absolutely leading position with a share of 51.7 %, followed by European countries with 32.3 %. The highest relative growth rate could be observed in South and Central America with 496 %. In contrast to chicken meat turkey meat production is still only of minor importance in Asia. Consumption of this meat type has no tradition in South and Eastern Asia.
Table 3: Development of global chicken meat production between 1990 and 2009; data in
1,000 t (Source: FAO database)
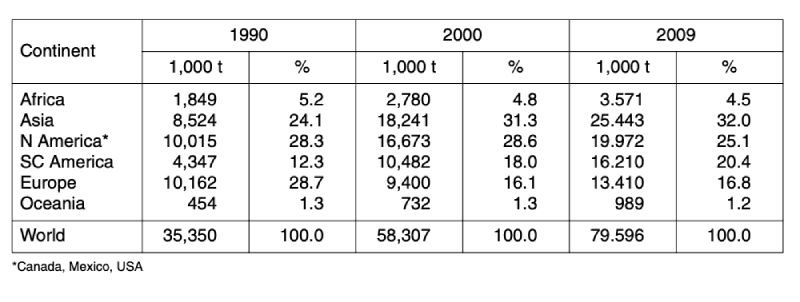
Table 4: Development of global turkey meat production between 1990 and 2009; data in
1,000 t (Source: FAO database)
Assuming that the skatole level can be significantly reduced by management and nutrition, genetic approaches may focus on controlling androstenone.
Androstenone is produced in the gonads along with other sexual steroids, androgens and estrogens. Therefore we should be aware of possible antagonistic correlations between androstenone and reproductive performance (Claus, 1993). Published estimates of genetic correlations between andostenone and paternal or maternal reproductive traits are, however, rare.
Bergsma et al. (2007) reported antagonistic correlations between androstenone and paternal fertility in terms of sperm motility (0.32), ejaculate volume (0.18) and livability of sperm (0.11), whereas the correlation with sperm concentration pointed in the desired direction (-0.22). In the same study, antagonistic correlations were found between androstenone levels in backfat probes and maternal reproductive performance in terms of sexual maturity and age at first insemination (-0.24), interval between weaning and subsequent conception (-0.44) and number of stillborn piglets (-0.59).
Willeke (1987) concluded from his analysis that selection for reduced androstenone level would have the undesirable effect of increasing the age at sexual maturity of boars as well as sows. Sellier et al. (2000) tried index selection for lower androstenone level while keeping the size of the bulbourethal gland constant, but failed.
Own study
To answer the question of an assumed commercial breeder who has to determine which selection approach is most promising, we modeled several different scenarios, applying index theory (proportional index) to predict the possible reduction of androstenone levels (Tholen and Frieden 2010). Table 3 shows the traits to be measured. It is assumed that the androstenone level can be measured in live boars from backfat probes obtained by microbiopsyTable 3: Traits to be measured for performance testing boars

Table 4 shows the relative importance and expected economic progress in the traits included in the index as breeding goal, separately for dam and sire lines. The parameter estimates are based on own analysis of German herdbook data and literature (Sellier et al., 2000). For androstenone we assumed a heritability of 0.50.
Table 4: Breeding goals and predicted relative economic progress (in %)
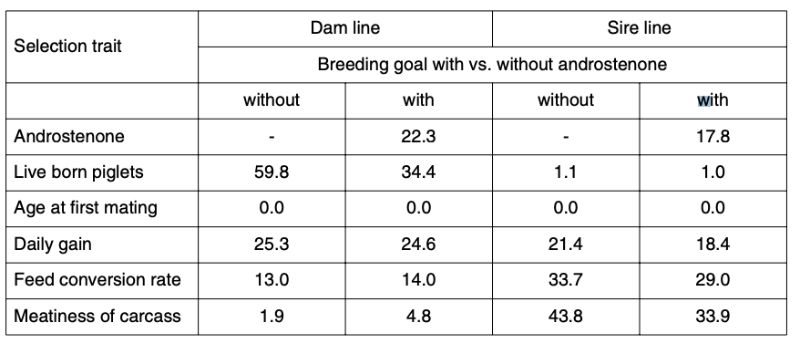
The economic weights (w) differ considerably between the sire and dam lines: the dam lines are mainly selected for number of piglets weaned per year, the sire lines for carcass composition. Change in age at first service was set to zero for all lines. Antagonistic correlations between androstenone level and reproductive performance were assumed to be rg = |0.2|.
The economic weight for androstenone level was determined with the condition that 80% of the progress in conventional traits should be retained. In each generation the best 10% males and 50% females are selected in both lines.
Inclusion of the androstenone level in the index results in significantly less progress in reproductive performance, but slightly more progress in carcass value in the dam line, whereas considerable progress in meatiness is sacrificed in the male line to achieve a reduction in androstenone levels.
Figure 1: Predicted frequency of boars with >1 µg/g androstenone in backfat probes if this
trait is included in a proportional selection index
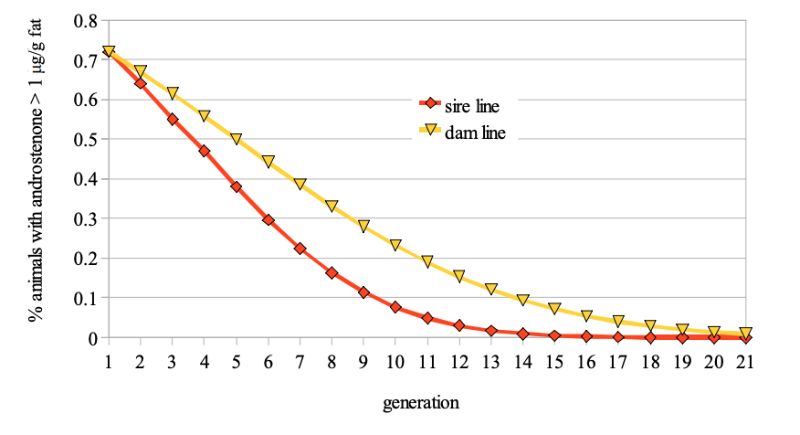
The model calculations suggest that at least 4 to 6 generations, i.e. 8 to 12 years would be required to reduce the frequency of boars with >1 µg/g fat from 20% to 5%, even with optimistic assumptions regarding the antagonistic correlation between fertility and boar taint (fig. 1).
Our estimate of time required for a genetic solution may be compared with the result of Ducro-Steverink (2006) who calculated less than 5 years to reduce the incidence of boar taint from 30% to 10%, assuming a heritability of 0.40 for the androstenone level and ignoring negative changes in reproductive traits.
Reduction of boar taint with molecular genetic methods
Another breeding strategy to reduce boar taint in pork would be to identify the relevant genes with DNA chips. The pig genome has been almost completely sequenced, which offers the possibility to search for DNA markers associated with boar taint.Using genome analysis, the genome of individuals is described in terms of SNP (Single Nucleotide Polymorphism) markers and compared with the phenotypic expression of the relevant trait. Several recent studies in Europe have identified markers for boar taint. In a Dutch project reported by Duijvesteijn et al., (2010), 13.7% of the additive genetic variation in androstenone level could be explained by the five most important SNPs.
As a second step, genomic selection would be applied to identify and select individuals with the desired genotype of low androstenone level without the need for trait recording.
On first sight, genomic selection may seem to offer a quick and easy solution. Before drawing premature conclusions, the results of Grindflek et al. (2010) should be noted who found markers for fertility traits on the same locations of the chromosome as for androstenone level, which is not surprising in view of the described antagonistic effects. Moreover associations between markers and traits are known to be breed specific. In any case, genetic markers have to be identified in each population, with relevant correlations to other traits, before genomic selection is applied in practice.
Discussion and outlook
The intensity of boar taint in carcasses of intact boars can be reduced by selection. This can help the pork industry in gradually reducing the number of carcasses discarded because of boar taint and eventually eliminate the need for castration. To achieve optimal response to selection, standardized procedures for measuring the two main components of boar taint, androstenone and skatole, should be developed. Two current research projects (Anon, 2009a,b) are focused on the development of automated measurement of boar taint for use in slaughter lines of commercial abattoirs as well as on live animals for selection purposes. The eventual goal is to develop techniques for screening live boars for taint score, based on microbiopsy of backfat, saliva or blood samples, which would speed up genetic progress.The rate at which genetic progress can be reached will depend on antagonistic correlations between boar taint and reproductive traits. These genetic correlations have to be determined in relevant commercial male and female lines.
When identified QTLs for boar taint are being used in genomic selection, special attention should be on gene locations which are not known to be negatively correlated with reproductive performance.
Under current economic conditions in Germany it would make sense to screen terminal sires for boar taint before they are widely used for AI. This approach is currently being field tested with the German Piétrain population in the EN-Z-EMA project (Anon, 2009a). In case this approach does not lead to desirable results, testing of boars will be extended to all male and female lines.
Including the reduction of boar taint in the breeding goal will in any case decrease the rate of progress in other traits, which can mean a loss of competitiveness. A breeding organization may expect benefits from a significantly reduced rate of boar taint:
1) if commercial slaughter houses introduce incentives by paying a premium based on the rate of discarding carcasses due to boar taint; and/or
2) if growing intact boars is significantly more economical than growing castrated males in terms of feed conversion ratio and carcass value (Adam, 2009).
With increasing production of pork from intact boars, the processing industry has to expect substantial losses, because pork with boar taint has no market value. Any potential benefit of growing intact boars can only be realized if the frequency of rejected carcasses is substantially reduced below a critical level of 10% or even less. It will take a considerable number of years to find out whether the European pork industry will be successful in eliminating the need for castrating boars as postulated by animal welfare.
Zusammenfassung
Züchterische Möglichkeiten zur Verminderung der Ebergeruchsproblematik bei SchlachtschweinenDie Ferkelkastration in seiner bisherigen Form wird keine Zukunft in der EU haben. Es gibt einige Alternativen, wie z.B. die Ebermast. Hierbei stellt der Ebergeruch, welcher hauptsächlich durch die zwei Komponenten Androstenon und Skatol bestimmt wird, ein Problem dar. Allerdings kann Skatol durch Fütterung, Haltungsform und Hygiene reduziert werden, dagegen wird Androstenon hauptsächlich durch genetische Komponenten beeinflusst. Deshalb ist die züchterische Bearbeitung des Ebergeruchs vielversprechend aufgrund der hohen Erblichkeit. Ein Problem stellt dabei die unerwünschte Beziehung des Ebergeruchs zur maternalen und paternalen Fruchtbarkeit dar, die im Züchtungsprogramm berücksichtigt werden muss. Bei dem derzeitigen Stand wird es zwischen 8 und 12 Jahren dauern, um den Anteil Eber mit über 1000 ng Androstenon je g Fett von 20 auf 5 % zu reduzieren. Eine Verkürzung dieser Zeitspanne könnte die Genomische Selektion bieten. Jedoch wird die Selektion gegen Ebergeruch nur dann erfolgreich sein, wenn eine zuverlässige Technologie zur Verfügung steht, wie z.B. die „elektronische Nase“, die einen mit Ebergeruch behafteten Schlachtkörper am Schlachtband eindeutig identifiziert.

References
Anon., 2009a: Forschungsprojekt “Vermeidung von Ebergeruch durch züchterische Maßnahmen und neuartige messtechnische Erfassung (EN-Z-EMA)” bewilligt. http://www.zds-bonn.de/vermeidung_von_ebergeruch_durch_ zuechterische_mass.html.Anon., 2009b: Verzicht auf Ferkelkastration – QS bringt Forschungsprojekte voran. http://www.q-s.de/ fileamin/QS _Fileadmin/tt_news/091126_PM_ Foerderung_Forschungsprojekte.pdf
Adam, F., C. Schulze-Langenhorst und L. Büttfering, 2009: Düsser Ergebnisse zur Ebermast. Landwirtschaftliches Wochenblatt, 43.
Bergsma, R., E. Knol and H. Feitsma, 2007: Parameters of Al boars and predicted correlated responses of selection against boar taint. Proc. EAAP Meeting, Dublin.
Bracher-Jakob, A., 2000: Jungebermast in Forschung und Praxis. Arbeit im Auftrag der Eidgenössischen Forschungsanstalt für Nutztiere, Posieux.
Bonneau M. et al., 1992: Contributions of fat androstenone and skatole to boar taint: I. Sensory attributes of fat and pork meat. Livestock Prod. Science 32, 63–80.
Claus, R., 1993: Die unendliche Geschichte der Ebermast – Eine historisch-physiologische Analyse. Fleischwirtschaft 73, 449 – 453.
Duijvesteijn, N. et al., 2010: A genome-wide association study on androstenone levels in pigs reveals a cluster of candidate genes on chromosome 6. BMC Genet. 2010 May 20, 11:42.
Grindflek, E, 2010: Revealing genetic relationships between compounds affecting boar taint and reproduction in pigs. J Anim Sci. 2011 Mar;89, 680-92.
Harlizius, B. et al., 2008: Breeding against boar taint. An integrated approach. EAAP meeting, 26-27. March, Girona.
Haugen, J.E., 2009: Detection of Boar Taint. Need for harmonised methods and rapid methods. 55. Intern. Meat Science and Technology Congress, Copenhagen. http://www.icomst2009.dk.kappa.headline.dk
Moe, M. et al., 2009: Association between SNPs within candidate genes and compounds related to boar taint and reproduction. BMC Genet. 2009; 10: 32.
Sellier, P., Le Roy, P., Foilloux, M.N., Gruand. J., Bonneau, M., 2000: Responses to restricted index selection and genetic parameters for fat androstenone level and sexual maturity status of young boars. Livestock Prod. Science 63, 265-274.
Tajet H., Andresen O., Meuwissen T., 2006: Estimation of genetic parameters of boar taint; skatole and androstenone and their correlations with sexual maturation. Prevention of Boar Taint in Pig Production. 19th Symp. Nordic Committee for Veterinary Scientific Cooperation, Gardermoen, Norway, 21-22 November 2005.
Tholen, E. and L. Frieden, 2010: Züchterische Möglichkeiten zur Vermeidung von Ebergeruch. 8. Schweine-Workshop “Neue Herausforderungen für die Schweinezucht”, 23./24.2.2010, Uelzen.
Weiler, U., M. Dehnhard, E. Herbert and R. Claus, 1995: Einfluss von Geschlecht, Genotyp und Mastendgewicht auf die Androstenon- und Skatolkonzentration im Fett von Mastschweinen, 14-32. In: Die Ebermast, Angewandte Wissenschaft Heft 449, Schriftenreihe des Bundesministeriums für Ernährung, Landwirtschaft und Forsten, Landwirtschaftsverlag Münster.
Willeke, H., R. Claus, E. Müller, F. Pirchner and H. Karg, 1987: Selection for high and low level of 5 α- androst-16-en-3- one in boars. I. Direct and correlated response of endocrinological traits. Journal Animal Breeding and Genetics 104, 64-73.
Xue, J. et al., 1996: Breed differences in boar taint: relationship between tissue levels boar taint compounds and sensory analysis of taint. J. Anim. Sci. 74:2170-2177.
