


Abstract
The dynamics of egg production between 1993 and 2013 on the basis of four Country Development Groups is analysed in this paper. This term is used to distinguish countries according to their development status. It can be shown that such a classification makes more sense than an analysis on the basis of continents and countries. The classification allows the documentation of the imbalance between their share in global population and their contribution to egg production. The driving force behind the remarkable dynamics in the analysed time period were the newly industrialised or threshold countries. In 2013, they dominated global egg production with a share of 57 %. A detailed analysis on the basis of the leading countries in each of the four groups makes it possible to identify countries with a fast growing production, those with a stagnating or even decreasing production volume. It can be shown that the regional concentration of production is very high in all four groups and that in particular in many developing countries absolute growth is still very low because of the development status, lack of capital and Know How and political instability.
Keywords
Laying hens, egg production, developing countries, newly industrialised countries, industrialised countries, regional distribution
Introduction
Compared to the large number of scientific publications dealing with the egg industry in industrialised countries, hardly any papers have been published so far on the role which developing and newly industrialised countries play in global egg production. The following paper will try to close this gap.
Classification of countries according to their development status
In this paper it will be distinguished between the following country development groups (CDG) 1- Least developed countries (LLDC)
- Less developed countries (LDC)
- Newly industrialised countries (NIC)2
- Old industrialised countries (OIC).
In table 1, the contribution of the four CDGs to the global population, the number of laying hens and the volume of egg production is documented. In 2013, 12.5 % of the global population lived in the LLDC, but they only contributed 2.0 % to global egg production. On the other hand, OIC only shared 15.2 % of the world population but contributed 24.3 % to the global egg production volume. In the LDC, the share of egg production was lower than that of the global population while in the NIC the contribution to the egg production volume was higher than to the global population.
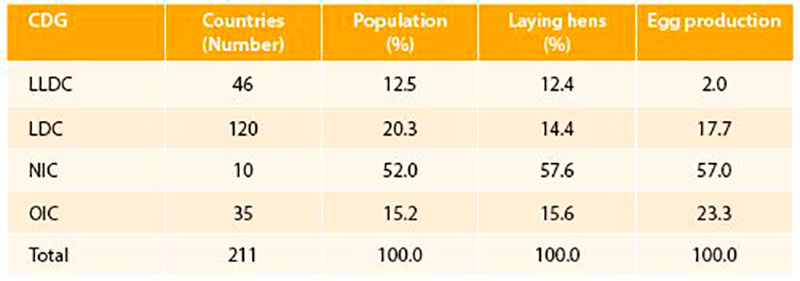
Table 1 Contribution of the CDG to the global population, the number of laying hens and to egg production (%) in 2013 (Source: FAO database; own calculations)
Development of laying hen flocks
The global number of laying hens increased from 3.7 billion in 1993 to 7.0 billion in 2013 or by 88.6 %. The NIC contributed 69.0 to the growth of the global laying hen population between 1993 and 2013, the LDC 21.0 % and the LLDC 7.5 %. The lowest relative growth rates showed the OIC with only 2.5 %.A closer look at the spatial dynamics reveals (Figure 1) that the OIC and the LDC lost shares of the global laying hen population in the analysed time period while the LLDC and the NIC gained 1.5 % respectively 10.1 % compared to their contribution in 1993. In 2013, the NIC countries were in an absolutely dominating position, mainly due to the 2.6 billion laying hens in China which contributed almost 38 % to the global laying hen population (see also Figure 2).
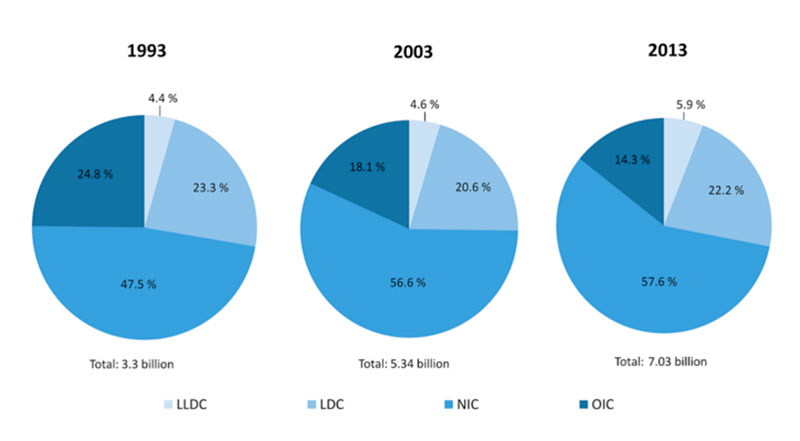
Figure 1 Contribution of the country development groups to the global population of laying hens, showing the significant increase in LLDC and NIC (2013) (Source: own calculations)
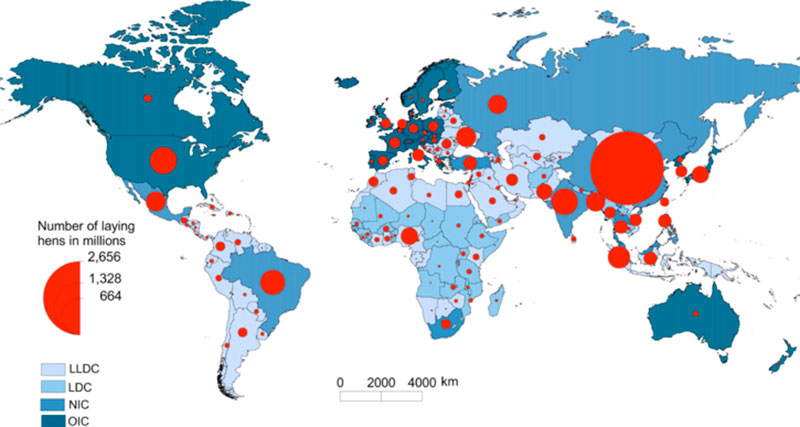
Figure 2 Global distribution of laying hens in 2013 in countries with different levels of development on country development base (Source: FAO database)
Development of egg production
Between 1993 and 2013, global egg production increased from 38.0 mill. t to 68.2 mill. t or by 79.5 %. The relative growth rate was lower than that of the number of laying hens. This is a result of the comparatively low laying rate of the hens in most of the developing countries. The highest relative growth rate showed the LLDC with 176.9 %, followed by the NIC with 123.2% and the LDC with 87.7 %. Similar to the dynamics in the laying hen population, OIC had the lowest relative growth rate with only 17.1 %, due to an already high production volume in 1993. The highest absolute growth is found in the NIC with 21.3 mill. t, followed by the LDC with 5.6 mill. t and the OIC with 2.4 mill. t. The NIC contributed 70.7 % to the global growth of egg production, LDC 18.5 % and OIC 7.9 %. Despite their high relative growth rate, LLDC shared only 2.9 % of the absolute global growth. Nevertheless the developing countries contributed 21.4 % to the global growth in egg production in the analysed time period in contrast to only 7.9 % of the old industrialised countries. This clearly documents in combination with the development in the NIC that the growth centres were no longer the OIC but the developing countries and in particular the NIC (Table 2).The regional shift of the egg production centres from the OIC in Europe and North America to the LDC and NIC in Asia and South America is obvious (Figure 3). The winners were the NIC while the OIC lost about one third of their former share in global egg production. The spatial distribution of egg production in the CDG on country base is documented in Figure 4.
The main results of the first part of the analysis can be summarized as follows:
- The global laying hen population grew by 3.3 billion hens or 88.6 % between 1993 and 2013. LLDC and NIC showed the highest relative growth rates.
- While OIC lost 10.5 % of their former contribution to the global laying hen flocks in the analysed time period, NIC gained 10.1 % and LLDC 1.5 %. The LDC could not maintain their share of 1993 and lost 1.1 %.
- Global egg production increased by 30.2 mill. t between 1993 and 2013 and reached a volume of 68.3 mill. t in 2013.
- To the absolute growth NIC contributed 70.8 % and LDC 18.7 %. In contrast, OIC only contributed 7.2 % and LLDC 2.9%.
- OIC lost 12.4 % of their share of the global egg production volume in the analysed time period; NIC won 10.9 %, mainly due to the remarkable growth of egg production in China and India. These two countries contributed almost 42 % to the global production volume in 2013.
- It is obvious that the production centres of egg production shifted from Europe and North America to Asia and Latin America.
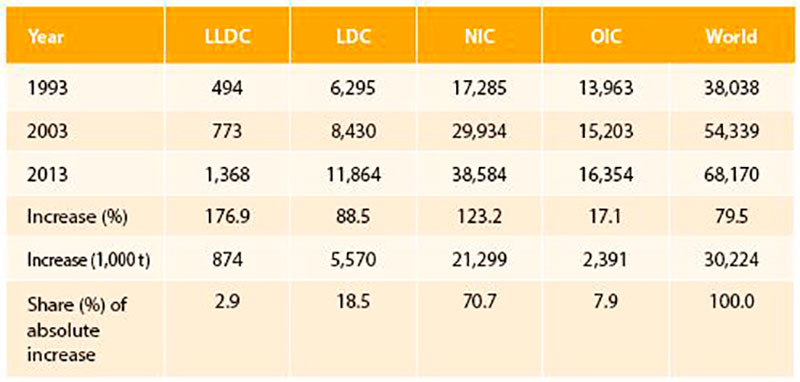
Table 2 Development of egg production in the Country Development Groups between 1993 and 2013; data in 1,000 t (Source: FAO database; own calculation)
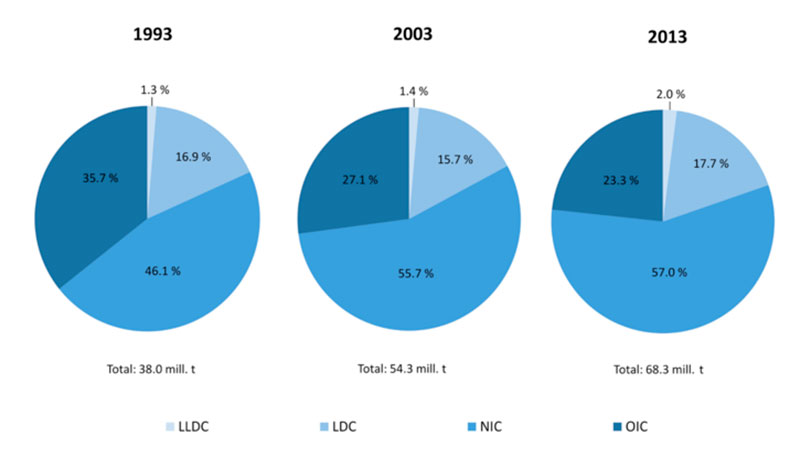
Figure 3 Contribution of the country development groups to global egg production (2013) (Source: own calculations)
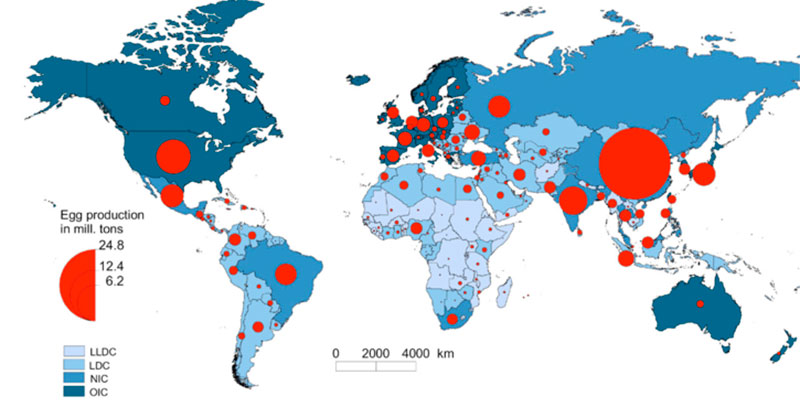
Figure 4 Global distribution of egg production in 2013 at country development base (Source: FAO database)
The dynamics at country level
In the following chapter the four CDG will be analysed in more detail on the level of single countries.Table 3 lists the ten least developed countries with the highest egg production in 2013. It is obvious that Myanmar and Bangladesh are the dominating two countries in this group. Together they contributed 48.9 % to the overall egg production volume of the LLDC. But their share of global egg production was less than 1 %.
The dominance of African countries documents the low standard of egg production in this continent. Lack of capital and know how as well as the instable political situation in several of these countries explain the low production volume. As many of the laying hens are kept in backyard flocks, the laying rate is very low. The small farmers mainly use local breeds for egg as well as meat production. In addition, this housing system is a constant risk regarding the introduction and dissemination of Avian Influenza. As in most of these countries no effective veterinary system is available, poultry diseases can cause high mortality rates in the flocks.
The ten countries with the highest egg production of the 120 less developed countries are listed in Table 4. Two of these countries, Indonesia and Ukraine, had an egg production volume of 1.2 respectively 1.1 mill. t in 2013. Together they contributed 20.7 % to the total egg production of this CDG. Five countries with more than 500,000 t of egg production followed on ranks 3 to 7. They shared 28.2 % of the production volume of this development group. The regional concentration of egg production in this CDG is very high. The seven leading countries shared 48.9 % of the overall production volume of the CDG, the ten listed countries 58.0%.
In contrast to the LLDC, in most of the LDC, laying hens are kept in conventional cages, at least on market oriented egg farms. They also use hybrid hens with high laying rates and compound feed. But in almost all countries backyard flocks still play a major role on small farms in rural areas.
Outbreaks of highly infectious poultry diseases, such as Avian Influenza, are a constant risk not only for the backyard flocks but also for the modern egg farms.
Newly industrialised countries are a group of ten countries in which a shift from a society in which the primary production sector dominated to a society in which the secondary production sector has the highest share of the gross national product. This shift occurred in the late 20th and the early 21st centuries. The standard of livingis higher than in the LDC and LLDC. They contributed 70.8 % to the growth of global egg production between 1993 and 2013 and shared 57.0 % of the overall global egg production volume in 2013. Table 5 reveals that within this group China is in a dominating position with a contribution of 63.7 % to the egg production in this CDG and 36.3 % to global production. It is worth mentioning that Turkey´s egg industry has grown considerably over the past decade and was already the second most important egg exporting country behind the Netherlands in 2013.
In Table 6, the ten leading egg producing countries in the group of OIC are listed. In 2013, they contributed 85.4 % to egg production in this CDG and 24.3 % to global egg production. Because of the already high production volume in 2013, the absolute as well as the relative growth rate was comparatively low. The USA and Japan shared almost half of the total egg production in this development group.
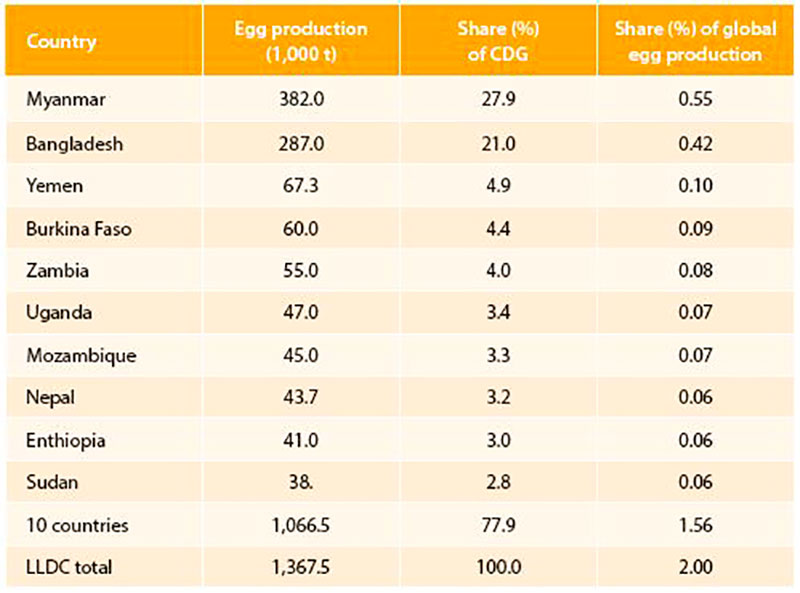
Table 3 Contribution of the ten countries with the highest egg production in the CDG of the LLDC and their contribution to the overall egg production in their CDG and to global egg production (2013) (Source: FAO database; own calculations)
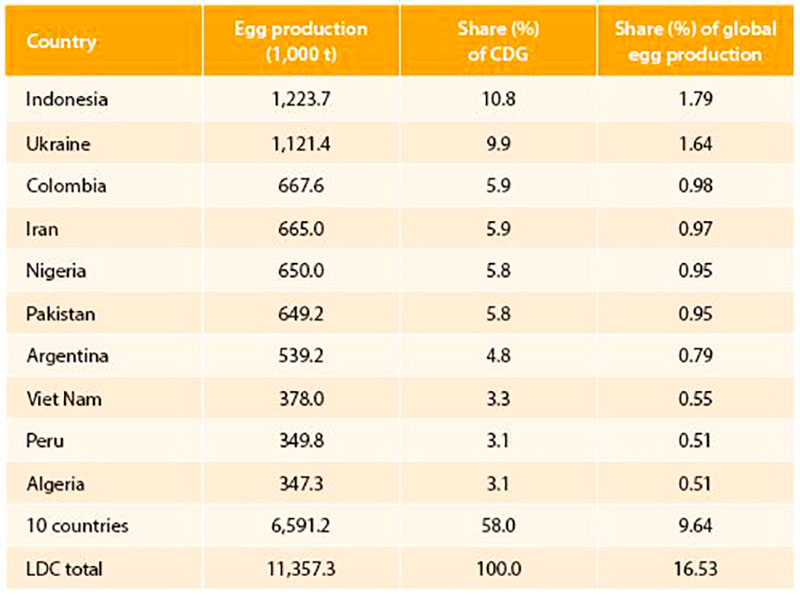
Table 4 Contribution of the ten countries with the highest egg production in the CDG of LDC and their contribution to the overall egg production in their CDG and to global egg production (2013) (Source: FAO database; own calculations)
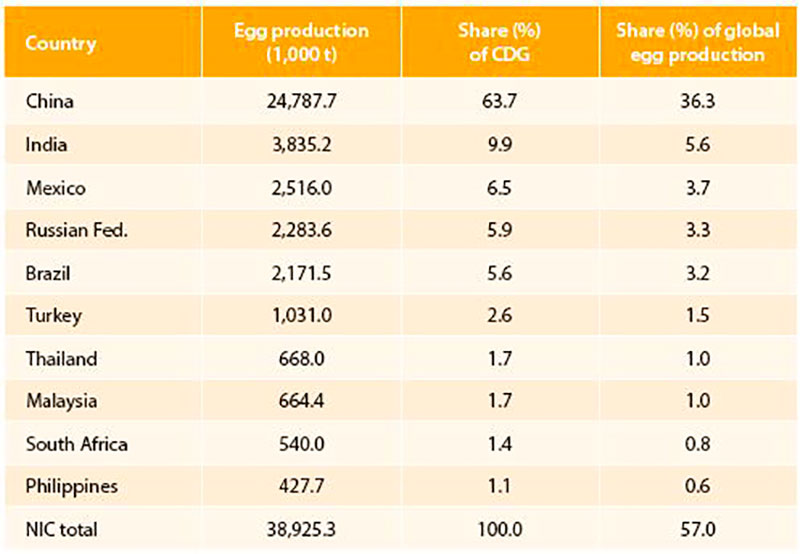
Table 5 Contribution of the NIC to egg production in their CDG and to global egg production (2013) (Source: FAO database; own calculations)
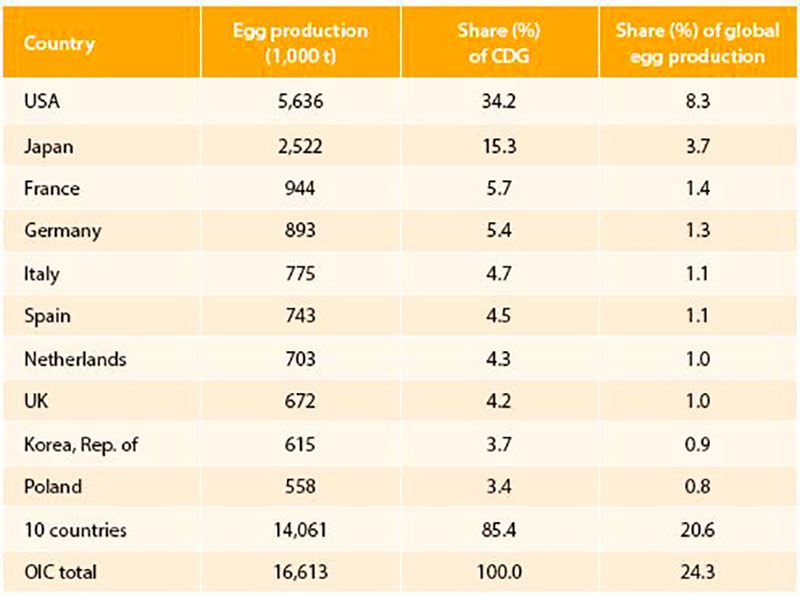
Table 6 Contribution of the ten leading OIC to egg production in their CDG and to global egg production (2013) (Source: FAO database; own calculations)
Winners
In the final part of this overview, countries with the highest increase in egg production between 2000 and 2013 are documented.Table 7 shows that of the ten countries with the highest increase between 2000 and 2013 four were located in Asia, four in the Americas and two in Europe, when one counts the Russian Federation and Ukraine as European countries according to FAO classification. The highest absolute increase had China with 5.9 mill. t, the highest growth rate Ukraine with 125.6 %. The four Asian countries contributed 8.6 mill. t or almost 50 % to the global increase in the analysed time period.
The main results of the second part of the analysis can be summarized as follows:
- The regional concentration in the four CDG differed considerably.
- In the group of the LLDC, Myanmar and Bangladesh shared 48.9 % of the total egg production. In the group of LDC, no such dominance could be observed. Here, the two leading countries, Indonesia and Ukraine, contributed only 20.7 % to the production volume of the group.
- NIC not only showed the highest absolute growth in egg production between 1993 and 2013, it also had a very high regional concentration with China in a leading position with a share of 63.7 % of the group´s egg production volume.
- In the OIC countries, the USA and Japan ranked in the first two positions with a contribution of 49.5 % to the overall production of this CDG.
- Regarding the increase of egg production between 2000 and 2013, Asian countries were in a dominating position.
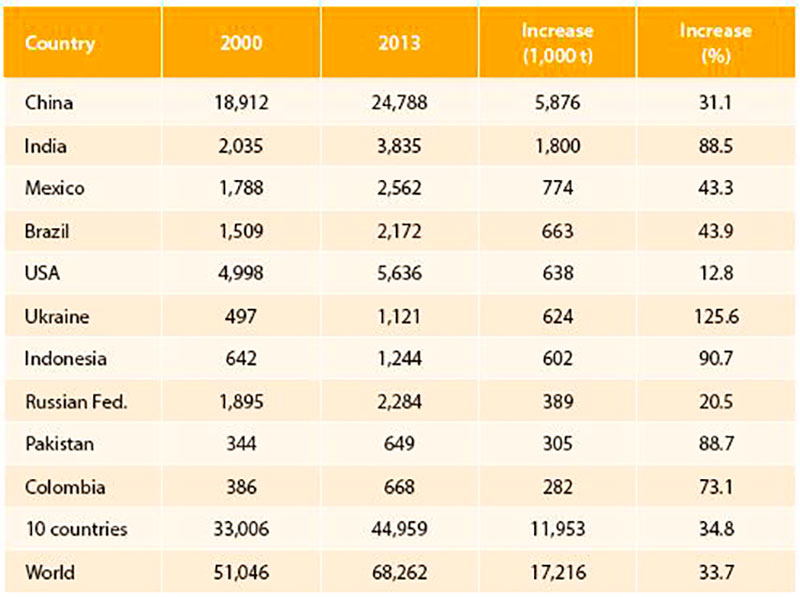
Table 7 Ten countries with the highest increase in egg production between 2000 and 2013; data in 1,000 t (Source: FAO database; own calculations)
Perspectives
The preceding analysis could show that the LLDC and LDC despite their share of 32.5 % of the global population only contributed 19.7 % to global egg production. The relative growth rates were much higher than in the OID countries. The absolute growth in LDC with 5.6 mill. t between 1993 and 2013 was the second highest behind the NIC. The NIC were the main driving force behind the remarkable growth of the global production volume with an absolute increase of 21.4 mill. t or a contribution of 70.8 % to the absolute global growth. It can be expected that this group will be able to fasten its position in the coming years because of a growing demand in several of the countries, especially the member countries of the BRICS group. The success of egg and poultry meat production in China can perhaps be an example for other threshold and developing countries with a widening middle class and a rising purchasing power. Even though the LLDC had the highest relative growth rate, they will not be able to increase their production volume considerably because of the instable political situation in many countries, the lack of capital and of Know How as well as the dominance of backyard flocks. The contribution of the OIC to global egg production will further decrease despite the absolute growth in most of the countries. The increase will mainly result from a growing population and not from a fast growth of the per capita consumption, as it is already comparatively high. Trade with shell eggs will also in future be much smaller than that with chicken meat, as they cannot be frozen. This is the reason for the dominance of regional production and trade over comparatively small distances.References
FAO database: http://faostat.fao.org/site/339/default.aspxOECD-FAO Agricultural Outlook 2014-2023: www.oecd.org
Windhorst, H.-W. (2014) The role of the BRICS countries in global egg production and trade. In: International Egg Commission (ed.): Annual Review, p. 4-9.
World Bank (2014) World development Indicators. http://data.worldbank.org/sites/default/files/wdi-2014-book.pdf.