


Introduction
The development of technology enables more accurate and efficient selection of breeding animals. This is particularly relevant for poultry, for which short generation intervals and relatively large populations allow rapid genetic progress. Over recent decades, we have seen implementation of increasingly complex and computationaly demanding statistical approaches to assess the genetic value of an individual using phenotypic and pedigree information. With the availability of genome sequence and the development of single nucleotide polymorphism (SNP) DNA marker chips, further improvements can be achieved. This paper shows how, from a historical perspective, genomic selection comes as a natural extension of previously developed methods and how it can be implemented to increase genetic gains in poultry.
Selection in poultry
Over the last 50 years, genetic selection in poultry has proven to be extremely successful, resulting in specialized egg laying breeds and fast-growing meat breeds that far exceed the production of their wild ancestors (see Figure 1 for layers).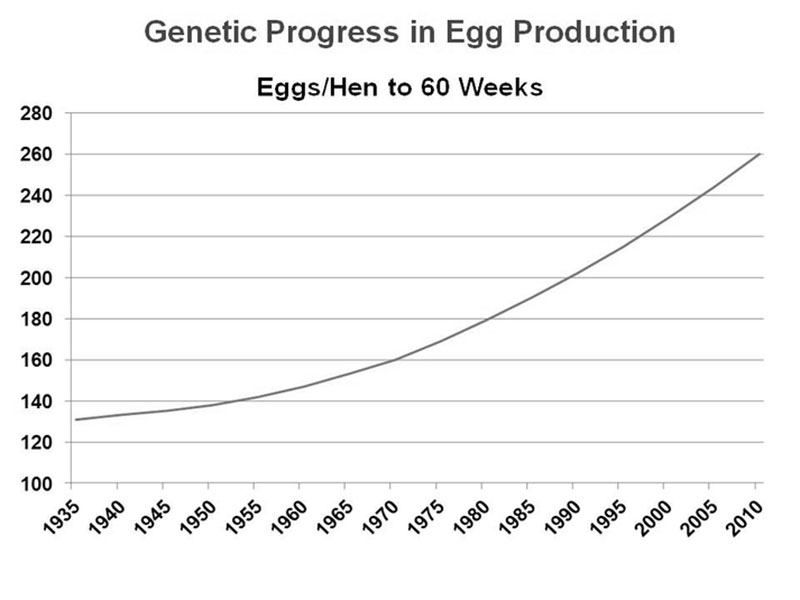
Figure 1. Improvement in average egg production of a brown egg layer line
This progress has been achieved by selecting and breeding above-average birds, which results in increasing the frequency of favorable alleles in the next generation. As the technology and computing capacity developed, methods have improved for determining which birds have superior alleles (or superior breeding values, represented by the sum of the effects of all alleles). During the early stages of poultry breeding, selection was based on the bird’s own performance, a strategy known as mass phenotypic selection. This method is efficient for traits with high heritability that are measured on all selection candidates (for example, body weight). However, this method is not as applicable to sex-limited traits (such as egg production and egg quality, resulting in males being selected at random) and is much less effective for traits with low heritability (for example, disease resistance).
Hazel (1943) proposed a method called “Selection Index” that optimally combines information on an individual’s own performance with that of one or more relatives (for example, mother, sister or progeny). This was, at the time, only practical for combining information from a few close relatives. Henderson (1950) published a further development based on his mixed model equations, which enabled the estimation of breeding values while correcting for known non-genetic differences between animals (for example, hatch-week or barn effects), but this was still only practical for close relatives. The predictions of breeding values from that approach have the properties of being Best Linear Unbiased Predictions (BLUP). Henderson (1976) and Quaas (1976) reported algorithms for forming the inverse of the numerator relationship matrix directly from the pedigree, and this made it practical for the first time to include information on all relatives. Utilizing all information increases the accuracy with which the breeding value of an individual can be assessed. Quaas and Pollak (1980) described more details of the computing approach that allowed BLUP to be used for multiple traits in large populations.
Layer breeders adopted index selection mentions in 1950’s well after the technology was introduced and some were using reciprocal recurrent selection in the 1960s and 1970’s. BLUP was finally implemented in layers in the 1990’s. These genetic analysis methods did not directly use information on the genes themselves, rather they exploit information from phenotypes and pedigree.
After the discovery of DNA as the molecule that carries genetic information, methods of finding variation in DNA and characterizing the effect of these variants on phenotypes (physical traits) have been of great interest to researchers and breeders. Such studies, called “QTL searches”, (Quantitative Trait Loci) have led to the discovery of multiple regions in the genome that are associated with specific phenotypic traits. The intent was that, as important genomic regions influencing a trait were identified, this information could be used for marker-assisted selection (MAS), thus greatly enhancing genetic improvement. This was successful only to a limited extent and only for traits with simple genetic control (for example, the B21 allele from the B blood group conveys resistance to viral diseases, as discovered by Briles et al., 1977). Most quantitative traits are influenced by many regions in the genome, each with a small contribution to the variation. Furthermore, the exact position of these QTL was difficult to map, primarily due to insufficient markers being available, too few animals being genotyped in these experiments and limited effective population sizes (see wide confidence intervals in www.animalgenome.org database for QTL from papers based on studies using small numbers of markers and too few animals).
Genomic Selection
Decoding the genomic sequence revealed millions of places where birds differ from each other at a single nucleotide (single nucleotide polymorphism, SNP). This accomplishment enabled the development of methods that allow for simultaneous rapid genotyping of birds in thousands of genomic locations at much lower cost per genotype. Soon after the release of the draft chicken genome sequence (Hillier et al., 2004), the EW Group started to develop its first SNP panel. Thanks to rapid technological advances, the chip density increased from 6,000 (Andreescu et al., 2007), to 12,000 (Powell et al., 2011), to 42,000 (Wang et al., 2013) and recently to 600,000 SNPs (Kranis et al., 2013). Similarly, the number of available genotypes for analysis has increased from a few hundreds of individuals per line initially to tens of thousands birds now. This massive amount of data required new methods of analysis. Meuwissen and co-workers (2001) proposed simultaneously using all information from the whole genome to estimate breeding values rather than using information from only a few large QTL. This approach, known as genomic selection or genomic prediction, started a revolution in animal breeding as high-density SNP chips became available. Some of the promises of genomic selection include improved accuracy of breeding values, a slower increase in homozygosity (i.e., inbreeding), the greater possibility to select for sex-limited and hard-to-measure traits, and shortening generation intervals.Imputation
In addition to computing efforts, the main challenge of genomic selection is the high cost of genotyping. Such investment can only be justified for limited use in parents in pure lines from which genetic progress is generated. Genetic progress achieved in the pure lines moves through levels of multiplication in the pyramid-shaped population structure (Figure 2), such that even small improvements in the pure lines have a large impact on the industry because of the high number of descendants at the commercial level.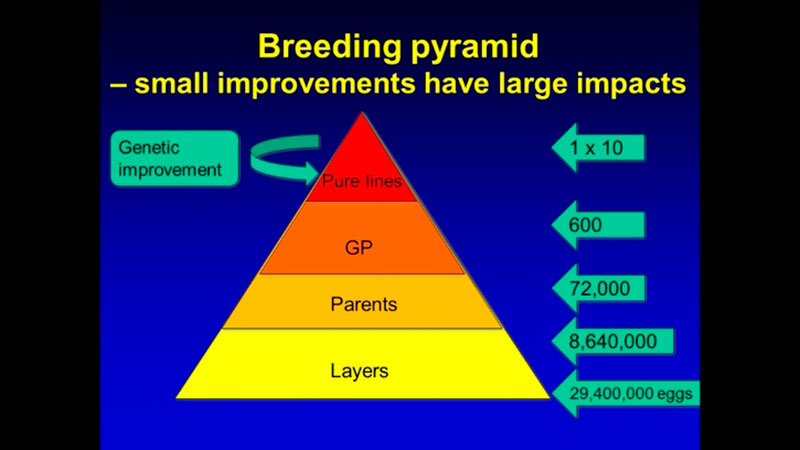
Figure 2. Structure of poultry breeding program. Multiplication of the generations amplifies the progress achieved in the pure lines.
For example, a one-gram change in egg weight could translate into 29 extra tons of eggs at the level of the direct descendants that are the commercial layers. To improve the economic efficiency of the genomic selection process, a method called imputation was developed. In that method, selection candidates are genotyped with a low-density SNP panel of thousands rather than tens or hundreds of thousands of SNPs, at a fraction of the cost of the higher density panels, and “missing” genotypes are then filled in (imputed) based on the information from high-density genotyped parents, using rules of Mendelian inheritance and probability (Figure 3). Only a limited loss of accuracy was shown when comparing estimated breeding values based on true and imputed genotypes (Wang et al., 2013). Thus, strategic combination of high- and low-density genotyping with genomic breeding values used for selection at younger ages is likely to be the next big step in genetic improvement of poultry.
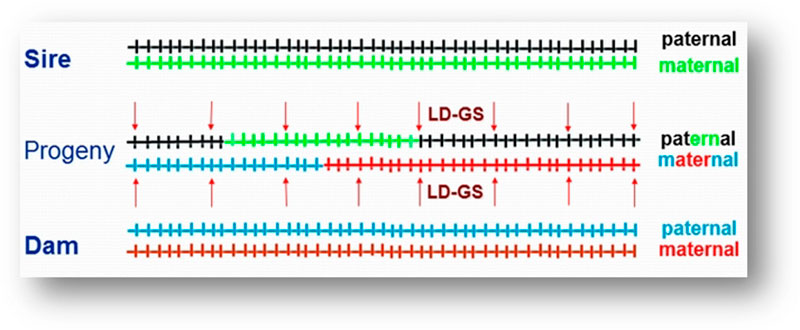
Figure 3. Imputation. Sire and dam are genotyped at all markers. Progeny receives one chromosome each from sire and dam (a combination of their maternal and paternal chromosomes). These chromosome fragments are tracked down using the lower density markers (arrows) and the markers that were not genotyped in progeny are filled in using information from the parents. (Figure by C. Wang)
Proof of Concept
To verify if expectation of increased genetic gain by using genomic information could be fulfilled, a selection experiment was designed by Iowa State University and Hy-Line International (Wolc et al., 2011). A pure line of brown egg laying chickens was divided into two sublines and for a 3-year period one line was selected at the usual age based on conventional pedigree-based predictions while the other was subjected to earlier selection based on genomic predictions. The selection index contained 16 production and egg quality traits and was used to select breeders using either Traditional Phenotypic/Pedigree data (based on individual and family performance results) or Genomic Selection, using genomic and phenotypic data. Before beginning the comparison, the basic criteria required to perform Genomic Selection were developed (Figure 4).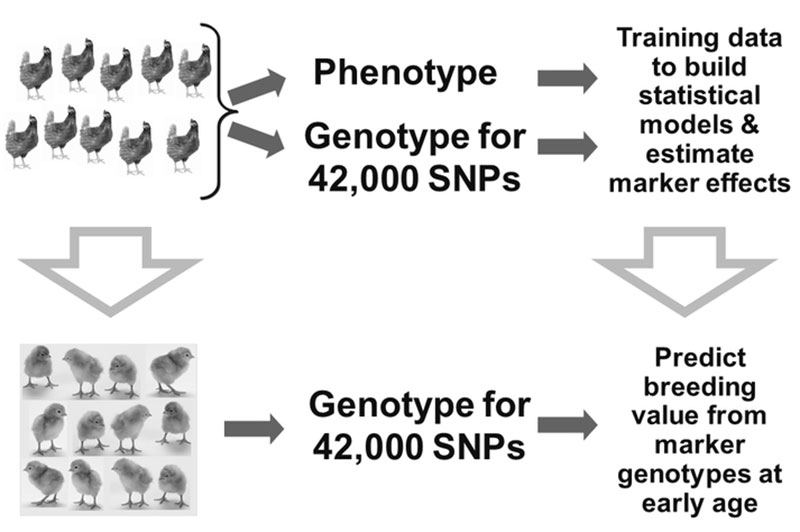
Figure 4. Example of a selection program using genomic information
Information on genotypes from a 42,000 SNP panel was collected on a large number of phenotyped individuals. This initial group of animals (known as the training set) was used to determine the effect of every marker that was genotyped on each of the 16 traits under selection.
The Genomic Selection line was selected using predictions based on the genotypes and estimated marker effects (as estimated from the training set), as soon as genotypes could be determined on the next generation, i.e. soon after hatch. This resulted in an approximate halving of the generation interval. Based on genomic breeding values, the best animals were selected as parents of the next generation, without waiting until their phenotypes (i.e. performance results) were available. When phenotypes became available, they were added to the training set and the resulting training data were reanalyzed for use in the next generation.
Birds from the Genomic Selection line produced a new generation of birds every 7 months. To reduce the cost of genotyping without increasing the expected accumulation of inbreeding per year, the active population size was reduced to 50 male and 50 female parents, with females mated to multiple sires. In contrast, the Traditional Phenotype/Pedigree line was selected every 13 months, with 60 males and 360 females used to produce the next generation.
After 3 years, the last generations of layer progeny from both lines were housed together in the same barn and evaluated for a normal production cycle to allow fair comparison of the progress from the two selection strategies. Because of the shorter interval between generations, the Genomic Selection line had 4 generations of selection, while the Traditional Phenotype line had only 2 generations of selection.
For 12 out of 16 traits measured, the last generation of Genomic Selection layers outperformed the Traditional Phenotype Selection layers. The progress originated from both better accuracy of breeding values and faster turnover of generations. Data analysis showed that accuracy of genomic breeding values was highest in close relatives of individuals in the training set, thus phenotyping continues to play an important role. Thus, this project demonstrated that Genomic Selection could be successfully applied in poultry breeding to enhance genetic gain.
Implementation of genomic selection in layers
Based on the promising results from the selection experiment, genomic selection was implemented by Hy-Line International in other lines of layers using the newly developed 600000 SNP chip (Kranis et al., 2013) and custom designed low- and moderate-density SNP sets. With as few as 1,000 high quality SNPs and strategic high-density genotyping, high accuracy of imputation using pedigree-based methods was achieved. Genomic selection models showed improvements in accuracy over pedigree-based analysis, particularly in traits with moderate to high heritabilities. Thus, routine non-research application of genomic selection was started in 2013, and the first genomic selected birds will generate descendants that will enter the market as commercial birds in 2015.Experience with genomic selection in broilers
Successful validation with real data was followed by rapid development of analytical tools and incorporation of genomic approaches in the broiler breeding industry (Avendaño et al., 2010; Avendaño et al., 2012). Implementation of genomic selection in pedigree Aviagen broiler lines started in 2012 (Aviagen, 2012).Imputation
Imputation from low-density to high-density genotypes, as described above, has allowed cost-effective implementation of genomics in broiler breeding. Routine implementation of large-scale and robust imputation approaches provides high accuracies of imputation of around 0.97 in immediate offspring. Thus, genotyping costs are reduced without compromising the accuracy of Genomic Breeding Values (Wang et al., 2013).Accuracy
One of the main promises of incorporating genomic information is the improved prediction accuracy for traits for which phenotypes are not available on selection candidates. For such traits, all full-sibs (sisters and brothers) get the same estimated breeding values when using pedigree based methods (equal to the average estimated breeding value of parents), unless selection is delayed until progeny records become available. However, with genomics used in prediction it is possible to effectively select within families without waiting for additional phenotypic records. This is illustrated in Figure 5, where parental averages (PA) are plotted against genomic breeding values (GEBVs).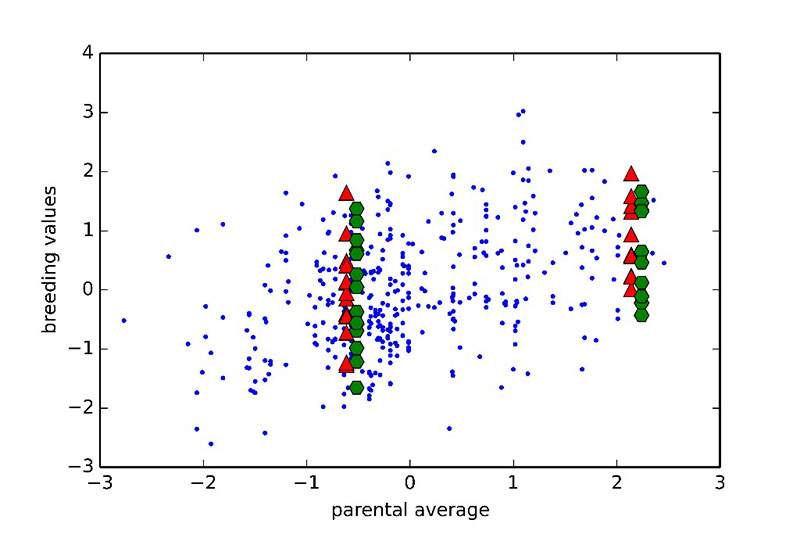
Figure 5. Relationship between genomic breeding values (red triangles: GEBVs, green hexagons: adjusted progeny means) and parental average (PA) from a pedigree-based BLUP. Two families are shown (one with low PA on the left and one with high PA on the right). All sibs have the same PA, however there is significant variation in GEBVs, suggesting some sibs rank highly in the cohort. This observation was validated using adjusted progeny means for the full sibs of the two families.
Two families are highlighted in the graph. Family 1 had below average PA values and thus would not be selected. Nevertheless, if the GEBVs are considered (red upper triangles in the graph), individual birds in this family rank from well below to well above average. So, using genomic prediction those full-sibs that rank high may now be selected. The opposite applies to Family 2 for which, although the PA is very high, some of the individuals rank quite low for GEBVs. As all of these candidates had at least 25 offspring with records, it was possible to accurately estimate the true breeding values, and these estimates confirm superiority of the genomic approach to prediction. Further illustration of the relative advantage in prediction accuracy of genomic selection over a traditional pedigree-based approach is shown in Figure 6. The comparison included pedigree-based estimates and GEBVs for reproductive traits and breeder livability. The relative improvement from implementation of genomic selection in terms of selection accuracy, measured as the correlation between phenotype adjusted for fixed effects and pedigree/genomic EBV at the point of selection, when animals had no phenotypic records, ranges between 20% and 70% (Figure 6). These are significant improvements in accuracies which will translate into benefits to the broiler industry.
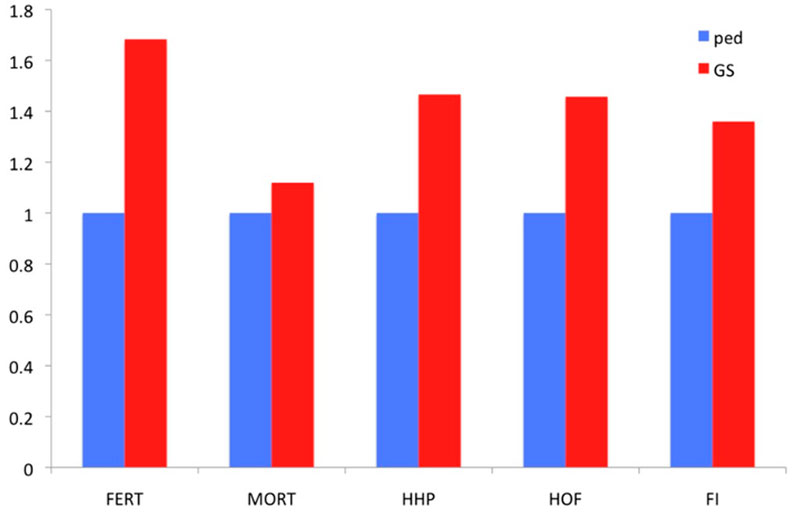
Figure 6. Relative improvement in prediction accuracy of genomic selection (GS) over pedigree-based (Ped) EBVs, measured as the correlation of EBVs with adjusted phenotype for 5 traits: fertility % (FERT), laying mortality (MORT), hen-housed egg production (HHP), hatchability % (HOF) and feed intake (FI).
With the rapid accumulation of genotypes in a commercial breeding program, poultry improvement has already entered “big data” territory, and thus more sophisticated tools and computational resources are required to cope with breeding value predictions. One of the factors increasing computational requirements is the number of markers considered in the analysis. As SNP panels with higher density and DNA sequence data become more widely available, and with continuous development of analytical tools and methods, the accuracy of selection is expected to further increase.
Outlook
We have successfully implemented, and demonstrated a significant advantage for, genomic selection in broiler selections using imputation from low- and medium-density SNP chips. However, reducing the cost of genotyping remains a challenge. Very low coverage sequencing offers the potential to exploit the dramatic reduction in sequencing costs, because it uses low density sequence coverage to identify SNPs in selection candidates. The SNP data are then used for two benefits: first, as a low-cost genotyping method to enable imputation and, second, to identify rare polymorphisms/causative mutations from large scale QTL mapping studies, which have the potential to improve training and therefore the accuracy of genomic evaluation. The utility for low coverage sequencing in broiler breeding remains unproven; however there is significant excitement for this methodology in the plant breeding world to warrant further evaluation.Because genomic selection is now part of routine evaluations for broilers and layers, a natural progression is to expand into other poultry species. Recent advances in sequencing the turkey genome (Dalloul, 2010) offer the necessary foundation to implement genomic selection to achieve faster genetic progress in that species.
Summary
Genomic selection is a recent paradigm shift for animal and plant breeding. The availability of hundreds of thousands of markers covering the entire genome has provided an opportunity to increase the accuracy of estimated breeding values, better manage genetic variation and shorten generation intervals. This paper summarizes how these new techologies are being applied to layer and broiler breeding programs to enhance genetic improvement. Results indicate that genomic information applied to layer and broiler breeding contributes extra selection accuracy in traits of economic importance.
References
Parts of the paper were originally published in WOLC, A., DEKKERS, J., SZWACZKOWSKI, T. (2013): Nowe perspektywy genetycznego doskonalenia drobiu. Polskie Drobiarstwo 8:8-10.WOLC, A., KRANIS, A., ARANGO, J., et al. (2014): Applications of Genomic Selection in Poultry. In: Proceedings of 10th World Congress on Genetics Applied to Livestock Production. 17-22 Aug 2014. Vancouver, Canada.
WOLC, A. (2014): Understanding Genomic Selection in Poultry Breeding. World’s Poultry Science Journal 70:309-313.
ANDREESCU, C., AVENDAÑO, S., BROWN, S.R. et al. (2007): Linkage disequilibrium in related breeding lines of chickens. Genetics 177:2161-2169.
AVENDAÑO, S., WATSON, K. A., KRANIS, A. (2010): Genomics in poultry breeding: from Utopia to deliverables. In: Proceedings of the 9th World Congress on Genetics Applied to Livestock Production: 1-6 August 2010. Leipzig, Germany. Session 07-01. http://www.kongressband.de/wcgalp2010/assets/pdf/0049.pdf Accessed on 16.05.2014.
AVENDAÑO, S., WATSON, K.A., KRANIS, A. (2012): Genomics in poultry breeding – Into consolidation phases. In: Proceedings of the 24th World Poultry Congress: 5 – 9 August 2012. Salvador, Brazil. P.36. http://www.facta.org.br/wpc2012-cd/pdfs/plenary/Santiago_Avendano.pdf Accessed on 16.05.2014.
AVIAGEN (2012): Aviagen includes genomics information for the on-going improvement of its broiler products. http://en.aviagen.com/aviagen-includes-genomics-information-for-the-on-going-improvement-of-its-broiler-products Accessed on 07.10.2013.
BRILES, W.E., STONE, H.A., COLE, R.K. (1977): Marek’s disease: effects of B histocompatibility alloalleles in resistant and susceptible chicken lines. Science 195:193-195.
DALLOUL, R.A., LONG, J.A., ZIMIN, A.V., et al. (2010): Multi-platform next generation sequencing of the domestic turkey (Meleagris gallopavo): genome assembly and analysis. PLOS Biology 8:e1000475.
HAZEL, L.N. (1943): The genetic basis for constructing selection indexes. Genetics 28:476-490.
HENDERSON, C.R. (1950): Estimation of genetic parameters. Biometrics 6:186.
HENDERSON, C.R. (1976): A simple method for computing the inverse of a numerator relationship matrix used in prediction of breeding values. Biometrics 32:69-83.
HY-LINE INTERNATIONAL (2013): Hy-Line International invests in multi-year expansion program. http://www.worldpoultry.net/Breeders/Markets-Trade/2013/7/Hy-Line-Int-invests-in-multi-year-expansion-program-1317128W/ Accessed on 07.10.2013
MEUWISSEN, T.H.E., HAYES, B.J., GODDARD, M.E. (2001): Prediction of total genetic value using genome-wide dense marker maps. Genetics 157:1819-1829.
MOROTA, G., ABDOLLAHI-ARPANAHI, R., KRANIS, A., et al. (2014): Genome-enabled prediction of broiler traits in chickens using genomic annotation. BMC Genomics 15:109.
NEETESON-VAN NIEUWENHOVEN, A.M., KNAP, P., AVENDAÑO, S. (2013): The role of sustainable commercial pig and poultry breeding for food security. Animal Frontiers 3:52-57.
POWELL, J.E., KRANIS, A., FLOYD, J., et al. (2012): Optimal use of regression models in genome-wide association studies. Animal Genetics 43:133-143.
QUAAS, R.L. (1976): Computing the diagonal elements and inverse of a large numerator relationship matrix. Biometrics 32:949-953.
QUAAS, R.L., POLLAK, E.J. (1980) Mixed model methodology for farm and ranch beef cattle testing programs. Journal of Animal Science 51:1277-1287.
WANG, C., HABIER, D., PEIRIS, B.L. et al. (2013): Accuracy of genomic prediction using an evenly spaced, low-density single nucleotide polymorphism panel in broiler chickens. Poultry Science 92:1712-1723.
WOLC, A., STRICKER, C., ARANGO, J., et al. (2011): Breeding value prediction for production traits in layers using pedigree and marker based methods. Genetics Selection Evolution 43:5.
Glossary
Allele – an alternative form of a gene; for example white vs. brown allele in eggshell color geneBreeding value (BV) – sum of allele effects of an individual or twice the expected value of progeny of a given individual if it was mated to random individuals from the same population
DNA – molecule that encodes the genetic instructions as a sequence of nucleotides
Genome – genetic material of an organism encoded in DNA as genes or non-coding sequences of DNA or RNA
Genomic Selection – selection of animals using multitudes of marker genotypes covering the whole genome
Genotype – complete genetic information of an individual
Heritability – proportion of variation for a trait which can be attributed to genetic differences between individuals
Imputation – adding information on multitudes of markers to data for an animal that was genotyped with a limited number of markers
Marker-assisted selection (MAS) – selection of animals using information from a limited number of markers associated with the trait of interest
Mixed model equations (MME) – a set of equations which enable estimates of breeding values for animals from different contemporary groups
Phenotype – physical trait information; for example, body weight, eggshell colour, egg production, etc.
Pure line – a closed population of birds with specific characteristics that is used to make crosses to produce hybrids
Quantitative trait locus (QTL) – a position in the genome that is associated with the trait of interest
Selection – determining which birds of a current generation have the best combination of traits and are used to produce a subsequent generation with improved traits
Single nucleotide polymorphism (SNP) – change in DNA molecule at a single position. For example, ATTGCT→ATCGCT, which creates two alternative alleles
SNP chip (or microarray) – technology platform that allows rapid and relatively inexpensive simultaneous genotyping at many positions in the genome