


Introduction
“The feed consumption level is a critical measurement in determining the nutrient density of the ration fed to an individual flock. Consumption is affected by:1. Age of the flock
2. Energy level of the feed
3. Egg production rate and egg size
4. Environmental temperature
5. Breed and strain of chicken
6. General health of the flock
“Because there are so many factors which may affect feed consumption, the most accurate feeding system must be based upon actual on-the-farm records. Standardized feeding programs are more than likely to be more wasteful of nutrients and ultimately more expensive” (Bell, 1967).
Forty-five years ago, when the above article first appeared in Poultry International magazine, the measurement of a flock’s feed consumption rates was in its infancy. The size and management of individual flocks was such that very few egg producers kept track of their flock’s feed consumption levels. Methods to obtain the data were crude (in comparison with today’s methods) and were in most cases merely estimates. In a University of California publication (Bell, 1975), a list of nine methods to determine feed consumption was provided to the industry, discussing methods still in use today. By 2012, practically all commercial egg producers insist upon obtaining and using accurate feed consumption records.
Other early articles on factors affecting feed and energy consumption include: “Factors that affect feed conversion” (Bell, 1960), “Measuring feed consumption and adjusting your feeding program” (Bell, 1965), “Feed consumption of White Leghorn hens” (Bell, 1974) and “Summer/Winter feed consumption” (Bell, 1979).
Current Data Analysis
In the previous article to this, which appeared in the October, 2011 issue of this publication, we discussed the egg production and egg size results of an extensive five-year study of 74 U.S. LSLLite flocks. The current discussion will concentrate on the feed consumption and feed conversion results for these same flocks. The third article in this series will emphasize mortality and economic measurements.Feed Consumption
The list of factors (shown above) that affect feed consumption represents the major factors which are recognized as having a significant impact on the question. Their relative importance is recognized by various scientists in the prediction models they have constructed over the years (Summers and Robinson, 1995). Dozens of equations have been developed by scientists over the last 50 years. The data used for calculating such models are usually limited to small research flocks and represent data collected in the last 30-50 years with multiple strains and breeds no longer comparable to today’s commercial stocks.The scientists referred to have modified earlier prediction equations (models) and included a factor for « feather condition », while age per se is not accounted for. As shown in Table 1, the actual results calculated from our current field data are remarkably close to the prediction from the Summers & Robinson (1995) model.
Table 1: Energy Requirement Model for White Leghorn Laying Hens
(Summers & Robinson, (1995)
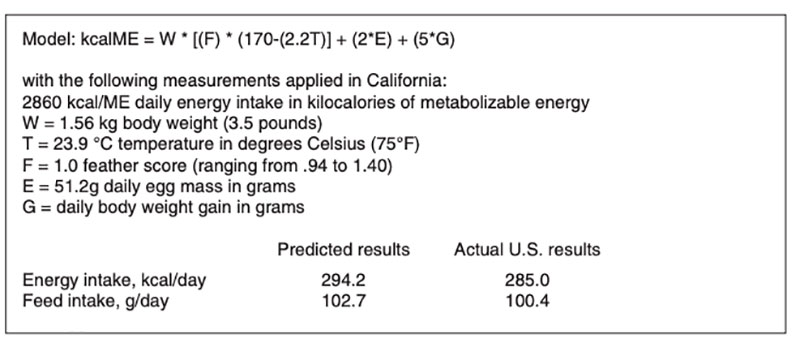
Using the data obtained in the University of California study of farm records during the housing period from 2001 to 2005, we observed a 9 kilocalorie lower energy requirement and a 2.3 grams lower feed consumption level than predicted from this particular model – both very small differences. Note: we did not assume any differences due to feathering, because such measurements were unavailable and are somewhat subjective. The research on feathering, though, does indicate that this is a significant contributor to the energy requirements of a flock. Table 2 lists the relative importance assigned to minor changes in various factors used in the Summers/Robinson equation. Models by other scientists usually include similar factors but with different levels of importance.
Table 2: Major Factors Affecting Energy Intake of Adult White Leghorn Layers
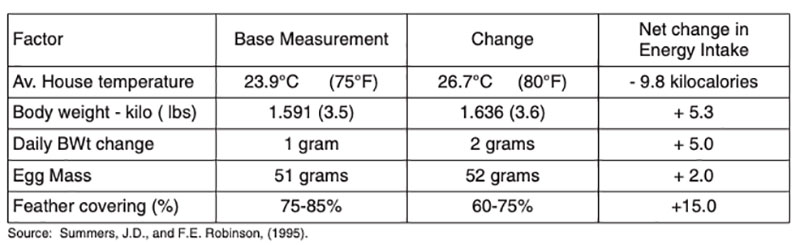
The changes in energy consumption based upon small changes in contributing factors are commonly in a range of 5-10% change when we assume a daily feed intake of 100 grams. For example, a body weight change of only 45 grams is associated with 5.3 kilocalories per hen-day; a change in house temperature of 2.8°C (5.0°F) is associated with 9.8 kilocalories; a 10-15% decrease in feather covering is associated with a 15.0 kilocalorie increase in energy consumption.
Feed Conversion
Egg producers in different countries define feed conversion or feed efficiency in a variety of ways. In all cases, the expression refers to a relationship between egg production and feed consumption. The ways of defining this, though, result in different indices:1. Pounds or kilos of feed per pound or kilo of eggs – this is probably the most commonly used term and reflects weight versus weight. This term is usually about 2:1.
2. The reverse of item #1 would express feed conversion as how many pounds or kilos of eggs are produced with 1 pound or 1 kilo of feed – usually about 0.5.
3. The method commonly used in the U.S. is pounds per dozen. This is less meaningful as it disregards the weight of the eggs. This ratio is usually in the 3.0 range.
In reality, this relationship should probably be expressed relative to energy usage. The answer would come out very similar to #1 above, but would represent a better efficiency measurement. The egg producer in the short-run, though, would be happy with the lowest cost measurement and this will be discussed in more detail in article 3 in this series.
Lohmann LSL-Lite Results – U.S.
The LSL-Lite first appeared in the U.S. with 2001 housing dates (18-20 weeks of age). Today, it represents the second most popular strain on commercial table egg layer farms. During the period 2001 to 2005 we accumulated weekly life-time data on 74 flocks totaling 5.9 million layers – averaging about 80 thousand hens per flock.The most recent project included 165 flocks of all Leghorn strains. Results were reported (without strain identification) in a series of newsletters published by the University of California (Bell, 2008- 2011). Earlier studies emphasized temperature and body weight effects on performance (Sterling, Bell, Pesti and Aggrey, 2003; Bell, 1979, 1982, 1998, 2005).
Table 3 lists the average feed consumption and conversion results by week for all flocks between 19 and 60 weeks of age. Sixty weeks was chosen as the closing age for this study to avoid the mixing of molted and non-molted flock data. Projections to 70, 80, 90 and 100 weeks can be easily derived from these data and standard regression analyses (see previous article for egg production results).
Variability of Results
The emphasis in the previous article was on management and its effect on the performance differences observed. Wide ranges of results are commonly seen in field studies. This was also seen in this study – even when the strains used were the same. Flock managers select many different programs in an attempt to maximize their returns and many factors are simply over-looked by management.The operator’s selection of factors, such as those listed in Table 2, are commonly two or more times as serious compared to the minor effects shown in the table. In other words, they may have a ten degree (F) difference between different tiers of cages or regions within the house, thereby affecting feed consumption by 20% or more.
Temperature differences within single houses as great as 10°F or 5.6°C result in major differences in a flock’s energy consumption and this makes scientific feeding to the nutrient requirements of the flock that much more difficult. One region of the house may be consuming 280 kcal per day while another region in a colder part of the house is consuming 336 kcal – and all the nutrients and costs that go with it.
In a study of the University of California, two large modern egg production houses with 100,000 hens each were temperature-mapped in 1998 (Kuney, 1998). Table 4 lists some of the key differences observed between three significantly large temperature zones – hot, cold, and moderate. No performance figures were available due to the automated feed and egg collection systems being used.
Table 3: Weekly Feed Consumption/Conversion (LSL-Lite White Leghorns hens) (average
results – 74 U.S. flocks – 2001 to 2005 housing dates)
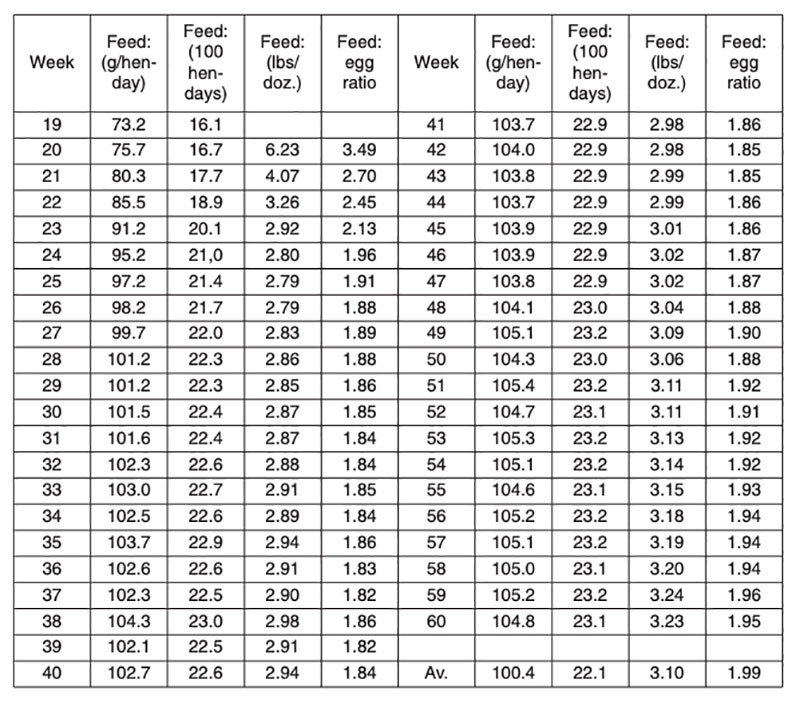
Table 4: House Mapping – Temperature Regions
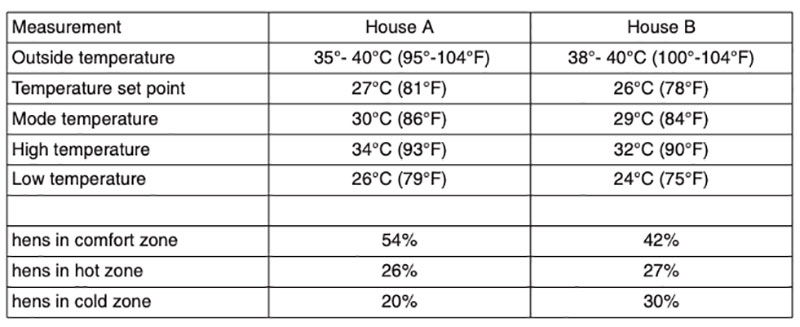
Of particular significance is that only 54 and 42 percent of the flocks were in the central temperature zone, and these are the only ones receiving the appropriate diet for their assumed performance rates. The cold zone hens would be over-fed their nutrients, while the hot zone birds would have been deficient. In this situation, the only choice the egg producer has would be to over-formulate the flock’s ration in order to provide the hot-zone hens adequate nutrient intake – and this is costly. Similar mapping would appear to be justified for multi-tiered houses – especially for vertical heights of 5 or more meters (15+ feet). The author has observed vertical height temperature differences of more than 9.4°C (15°F) in such houses.
Temperature variation may occur within a single house (as described above), between flocks as a result of Inconsistent management policies, by seasonal effects, poor housing design associated with the environment, and lastly as a result of a feeding policy which provides different temperatures for different ages of flocks. Our studies have clearly demonstrated the user-choice of increasing temperatures as flocks age. On some farms, this may be as much as 5-10 °F from the age at housing until 60 weeks. All of the above may become problems if nutrient densities in the rations are not adjusted to compensate for variations in feed intake.
The observed feed consumption differences in the U.S. study are a result of all the factors discussed. Low feed consumption, per se, is not necessarily a problem, nor is it a benefit. Recorded data about temperature seldom tell the full story. A flock with higher and lower peaks may yield the same average measurement as one that experiences a constant pattern throughout its life. Higher temperatures say nothing about the quality of air required to reach them – especially in the winter months.
It depends upon how the egg producer works with the issue and whether or not he/she has acted accordingly to the information – assuming it is reliable. Table 5 lists the extreme observations for various feed consumption/conversion measurements. Note that individual rows are not necessarily the same flocks, but only selected data.
Table 5: Best and poorest flocks per trait (different rows contain different flocks) (19 to 60
weeks of age, no molted flocks) (74 flocks of LSL – Lite White Leghorn hens)
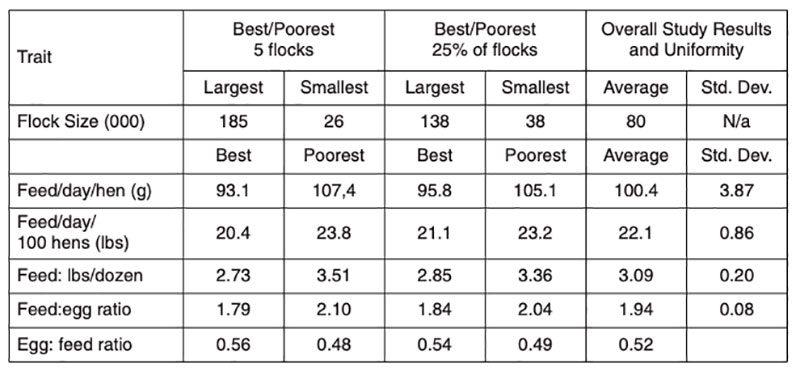
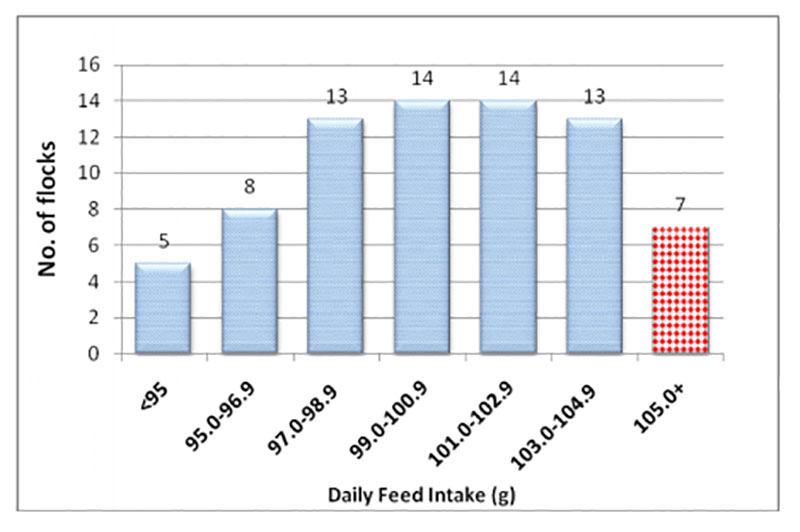
Figure 1: Frequency of Av Daily Feed Consumption Rates – 19 to 60 wks.
The author has provided the reader with a list of references and suggested reading on feed consumption, feed conversion, performance standards, temperature management, technological change, and other related subjects. Most of the articles listed can be obtained from the author.
No attempt was made to make this an overall review of the two subjects listed in the title but instead, primarily the research and observations of the author within the last fifty-year period.
References
Bell, D.D. (1960) Factors that affect feed conversion. Pacific Poultryman, May, pp 15, 57.Bell, D.D. (1965) Measuring feed consumption and adjusting your feeding program. Pacific Poultryman, November pp 18-21.
Bell, D.D. (1967) Phase feeding: cost cuter for large eggmen? Poultry International, October pp 26-32.
Bell, D.D. (1974) Feed consumption of White Leghorn hens. University of California Poultry Scratch, July.
Bell, D.D. (1975) Methods of measuring feed consumption in poultry flocks. University of California leaflet #2244.
Bell, D.D. (1979) Summer/Winter feed consumption. University of California, Poulry Letter, March.
Bell, D.D. (1982) Performance responses to temperature as affected by age in table egg flocks. World’s Poultry Science Assoc. Israel branch proceedings, December.
Bell, D.D. (1984) Small performance differences count in the egg business. Poultry Digest, February, pp 72
Bell, D.D. (1993) The egg industsry of California and the USA in the 1990s: a survey of systems. World’s Poultry Science Journal, vol. 49, pp 58-64.
Bell, D.D. (1995) Forces that have helped shaped the U.S. egg industry: the last 100 years. Poultry Tribune, pp 30-43.
Bell, D.D., (1998) The importance of managing laying house temperatures. World Poultry, November, pp 34-39.
Bell, D.D. (2005) . Contemporary layer flock performance record analyses – 2004-2005, Progress in Poultry #42. December.
Bell, D.D. (2008-2011) National Flock Performance Study, University of Callifornia, Egg Economic Update letters, nos. 285 to 335.
Bell, D.D. (2011) The challenges of management for today’s high performing laying hens – Part 1: Egg production and egg size. Lohmann Information, October 2011, pp 8-15.
Kuney, D.R. (1996) Temperature mapping of cage layer housing. University of California Poultry Symposium prodeedings.
Sterling, K.G., D.D. Bell, G.M. Pesti, and S.E. Aggrey. (2003) Relationships among strain, performance and environmental temperature in commercial laying hens. Journal of Applied Poultry Research 12: 85-91
Summers, J.D. and F.E. Robinson (1995) Comparative feeding programs for poultry reproduction. IN Poultry Production, edited by P.Hunton, p 329.
Swanson, M.H. (1979) Energy needs of laying hen can be quantified. University of California Poultry Letter, June
Zusammenfassung
Managementbedingte Varianz in der Leistung moderner Legehybriden Im zweiten Teil einer Serie von drei Beiträgen werden detaillierte Praxisergebnisse von 74 LSL Lite Herden in den USA hinsichtlich Futterverbrauch und Futterverwertung präsentiert. Das Leistungspotenzial heutiger Legehybriden ist wesentlich höher als in früheren Untersuchungen, und die meisten Legebetriebe arbeiten heute mit einer Stalltechnik, die eine Regulierung des Stallklimas gewährleisten sollte. Die in Abbildung 1 dokumentierte Streubreite des durchschnittlichen täglichen Futterverzehrs im Alter von 19 bis 60 Wochen lässt in beiden Extremen (unter 95g bzw. über 105g) Herden- bzw. Farmbezogene Besonderheiten vermuten, die aber im Einzelnen ohne genauere Informationen nicht erklärt werden können. Aus der Literatur und eigener 50-jährigen Erfahrung in der Betriebsberatung zitiert der Autor Beispiele, um zu verdeutlichen, wie verschiedene Faktoren zur Variabilität des täglichen Futterverbrauchs beitragen können. Um das Betriebsergebnis optimieren zu können, sind regelmäßige Aufzeichnungen des Futterverbrauchs und der Legeleistung, der Entwicklung von Körpergewicht und Eigewicht, der Temperatur in verschiedenen Stallbereichen und der Federverlust (vor allem in der zweiten Hälfte der Legeperiode bei niedriger Stalltemperatur) erforderlich, um die Futterzusammensetzung im Rahmen einer Phasenfütterung zu optimieren.
S'abonner à notre lettre d'information
Et découvrez toutes les dernières nouvelles du secteur.