


Abstract
Five years after the banning of conventional cages in 2012, the number of laying hens and of egg production has stabilized. Enriched cages are the dominating housing system with a share of 55.6%, followed by barn systems (25.7%), free range (14.1%) and organic systems (4.6%).The share of the four housing systems differs, however, considerably between the single member countries. Egg production increased by 6.1% between 2012 and 2017 and reached a volume of 7.5 Mio t. The regional concentration is very high. The fve leading member countries contributed 57.7% to the overall production volume of the EU. The EU is dominating global egg trade. More than half of all eggs which reach the international markets are either exported or imported by EU member countries. The Netherlands are the dominating egg exporting country, followed by Poland. Germany holds an unchallenged frst place among the leading egg importing countries.It is expected that between 2017 and 2025 egg production in the EU will grow faster than consumption resulting in an increasing egg surplus. If this cannot be exported either as shell eggs or as egg products, a lasting phase of low egg prices may be the result.
Keywords
EU, laying hen husbandry, egg production, egg trade
Introduction: The role of the EU in the global poultry industry
In 2015, the 507 Mio inhabitants of the 28 EU member countries contributed 6.8 % to the global population. The six leading countries alone shared 70.4 % in the population of the EU. With a share of only 6.8% in the world population, the EU contributed 21.8 % to the global gross national product (GNP). This documents the high development status of most of the member countries. But in 2015 the per capita GNP differed considerably between the member countries. With only 6,300 € in Bulgaria respectively 8,100 € in Romania the lowest values were reached, in contrast, the per capita GNP was highest in Luxembourg with 89,900 €, followed by Ireland with 55,100 € and Denmark with 46,800 €. In 17 of the 28 member countries the per capita GNP was lower than the EU average of 28,800 €.
The efciency of the EU poultry industry finds its expression in the contribution to the global production volumes of eggs and poultry meat. In 2015, the EU member countries shared 10.3 % in global egg pro duction and even 11.7 % in world poultry meat production. The EU is the only region in which laying hen husbandry in conventional cages is prohibited. In 1999, the EU Commission passed Directive 1999/74/EU which demanded from the member countries to ban conventional cages from 2012 on and to prohibit from 2002 on the installation of this housing system. The Directive allowed that member countries could prohibit conventional cages earlier than 2012. Austria and Germany made use of this regulation and banned this housing system already in 2010. This decision had, as will be documented in the following parts of the analysis, far reaching impacts on the development of the laying hen inventories, egg production and egg trade. This was especially the case in Germany because of the earlier banning and also in several other countries. For two to three years, the decision of the German government to ban conventional cages already in 2010 changed the intra-EU trade with eggs considerably. The self-sufciency in Germany dropped to less than 55 %, resulting in a sharp increase of egg imports from the Netherlands, Spain and Poland. As most of the changes in production and trade occurred between 2010 and 2015, the analysis is focused on this time period.
The main goals of this paper are:
- to analyze the dynamics of the laying hen inventories and of egg production between 2010 and 2015 in the member countries,
- to document the spatial shifts in egg production and egg trade between 2010 and 2015,
- to discuss present challenges for the egg industry in the EU member countries and to present perspectives considering these challenges.
1. Dynamics in the EU laying hen inventories and in housing systems
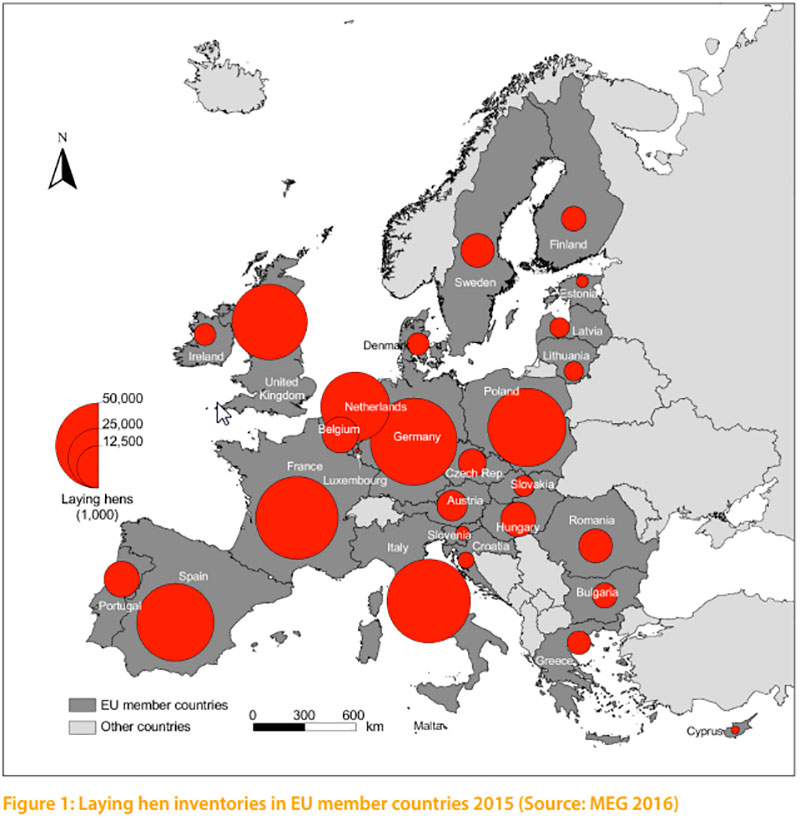
The frst part of this paper will deal with changes in the laying hen inventory in the EU and in the housing systems resulting from the implementation of Directive 1999/74/EU.Between 2010 and 2015 the number of laying hens in the EU increased from 362.6 Mio birds to 382.8 Mio birds or by 5.6 %. But the inventory decreased between 2014 and 2015, a result of the declining numbers in particular in Spain and Italy. The spatial distribution of the laying hen population in the EU member countries in 2015 is documented in Figure 1.
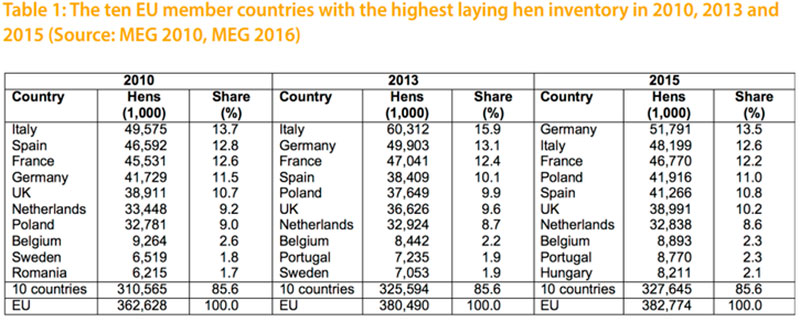
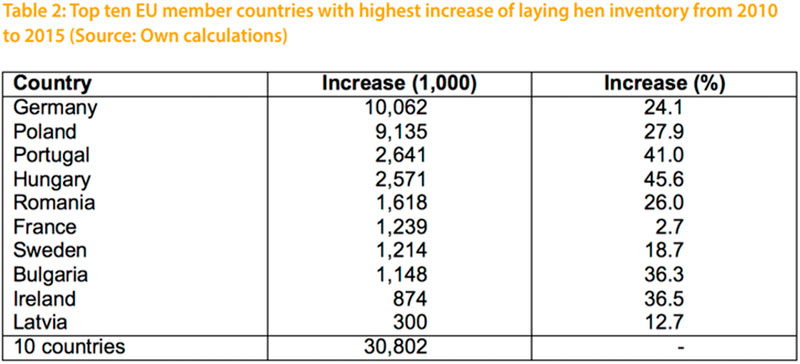
The regional concentration of the laying hens in the EU is rather high. As can be seen from the data in Table 1, the four countries with the highest inventories shared over 50 % of the total number of laying hens in 2010 and 2013 and over 49% in 2015. The share of the ten leading countries was very stable with 85.6 % over the whole time period. A closer look at the dynamics at country level reveals (Table 2) that the highest absolute increase occurred in Germany with 10.1 Mio and in Poland with 9.1 Mio hens. On the other hand, the inventories in Spain fell by 5.2 Mio hens and in Italy by 1.4 Mio. The high absolute growth in Germany is a result of the banning of conventional cages as early as 2010. The composition of the ten leading countries also changed in the analysed time period. Between 2010 and 2013 Germany won two positions and ranked at second place behind Italy. Romania was replaced by Portugal. In 2015, Germany ranked as number one, followed by Italy, France and Poland. Spain lost one position and Hungary replaced Sweden.
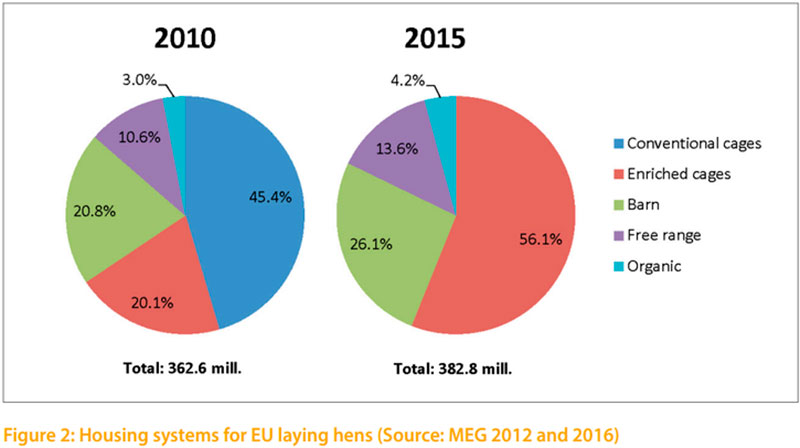
Because of the implementation of Directive 1999/74/EU, conventional cages had to be abandoned by 2012. This changed the composition of the housing systems for laying hens in the EU. In 2010, 45.5 % of the laying hens were still kept in conventional cages and only 20.1 % in enriched cages. Five years later, 56.1 % of the hens were housed in enriched cages, 26.1 % in barn systems, 13.6 % in free-range systems and only 4.2% in organic systems. Figure 2 documents that within a comparatively short time theshift from conventional cages which had dominated laying hen husbandry for several decades to alternative housing systems could be realized. When the EU Commission passed Directive 1999/74/EU in 1999, egg producers in many countries argued that the transformation to alternative housing system would be too cost intensive, lead to a turmoil on the European egg market and cause severe problems regarding the health of the laying hens. Even several years before the deadline of conventional cages some countries in Eastern and Southern Europe asked for a prolongation of the transformation period. This was not accepted by the EU Commission, arguing that the industry had had sufcient time to change their housing systems. In retrospective, most of the articulated fears did not come true even though the transformation caused problems in some countries.
2. Dynamics and spatial shifts in EU egg production
The following part of the paper will analyze the impacts of the transformation of the housing systems in laying hen husban dry on egg production at EU and member country level.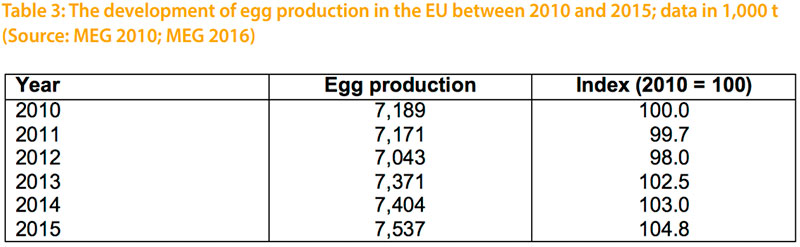
From the data in Table 3 one can see that the last phase of the transformation of the housing systems led to a decrease of egg production between 2010 and 2012 by about 150,000 t or 2 %. Once the transformation was concluded, the production volume increased again and was 350,000 t or 4.8 % higher than in 2010. The comparatively low decrease of the production volume during the transformation process is due to the fact that in some countries, especially in Southern Europe, conventional cages were permitted to be used parallel to the newly installed alternative housing systems. The remarkable growth of the production volume since 2012 resulted in an oversupply and a phase of low prices for the egg farmers. To stabilize the situation, placing of pullets was reduced in several countries, at least for a short time, without a lasting success, however.
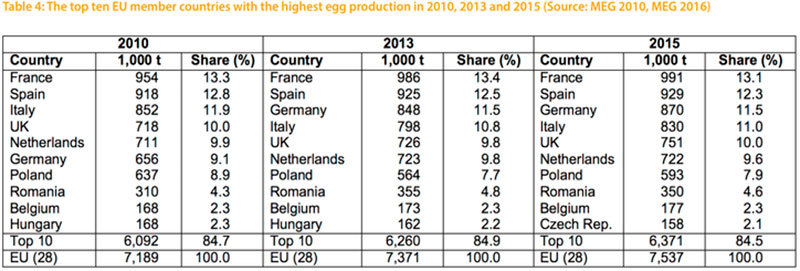
A closer look at the dynamics at country level shows (Table 4) that the regional concentration in egg production was also high even though a bit lower than in the laying hen inventories. The four leading countries shared between 47 % and 48 % in the total production volume of the EU. The contribution of the ten leading countries to the overall egg production in the EU was also very stable; it fluctuated only between 84.5 % and 84.9 % in the analysed time period. The composition of the ten leading countries was also very stable, only Hungary was replaced by the Czech Republic in 2015. In the frst four ranks the composition changed, however. In 2010, the United Kingdom had replaced Germany. This was a result of the banning of conventional cages in Germany as early as 2010 and a decrease of the production volume because of the necessary transformation to alternative systems with many empty layer places. In 2013, Germany ranked in third place again and the United Kingdom lost one position. In 2015, the four leading countries had stabilized their production again and the former order was re-established.
Between 2010 and 2015 Germany had the highest absolute growth with 240,000 t, followed by Romania, France, the United Kingdom and the Czech Republic. The highest relative growth values showed Germany and the Czech Republic. It has to be mentioned that the extraordinary increase in Germany is due to the earlier banning of conventional cages and the fast recovery of the laying hen inventories and of egg pro duction while the transformation in most of the other EU member countries began two years later. The absolute decline of egg production was highest in Poland with 44,000 t, followed by Italy and Hungary. The highest relative decrease was to be found in Hungary and Croatia. With the exception of Italy all countries with a considerable loss in their production volume were located in Eastern Europe.
The main results of the frst two parts of the analysis can be summarized as follows:
- The transformation of the housing systems in laying hen husbandry did not cause a drastic decline of the laying hen inventory. This is partly a consequence of the parallel use of the old and alternative housing systems in several member countries between 2010 and 2012.
- Egg production decreased by only 2 % between 2010 and 2012 because of the permitted parallel use. It recovered faster than expected and because of the expansion of hen places led to an oversupply with eggs and low egg prices at farm gate for some time, especially in late 2013 and in 2014.
- A reduction of placed hatching eggs and pullets was able to stabilize the situation for some time, but it was not before the second quarter of 2016 that prices reached a level again which allowed profts.
3. Dynamics and spatial shifts in EU egg trade
In contrast to poultry meat, shell eggs for consumption are not traded in large amounts and over long distances. Only about 2.9 % of the global egg production is exported respectively imported. Most of the eggs are traded within relatively confned areas. One problem in dealing with the dynamics and patterns of egg trade of the EU is that in some of the available data sets it is not distinguished between the trade between EU member countries and trade with non-EU countries. In the database of the FAO it is not possible to separate the egg trade between the member countries and non-EU countries. Of the 2 Mio t of eggs which are traded according to the FAO database, about 1.2 Mio t are exported by EU member countries. But less than 300,000 t are exported to nonEU countries. In the data set published by the Committee for the Common Organization of Markets of the EU Commission only trade with non-EU countries is documented. In this paper, only the dynamics and trade patterns of the EU with nonEU countries will be presented in a short overview, based on the data which the above-mentioned Committee of the EU Commission publishes regularly. Another data problem is that this data set includes the eggs equivalents for the exports of egg products. It cannot be decided, to what amount shell eggs for consumption or egg products were exported.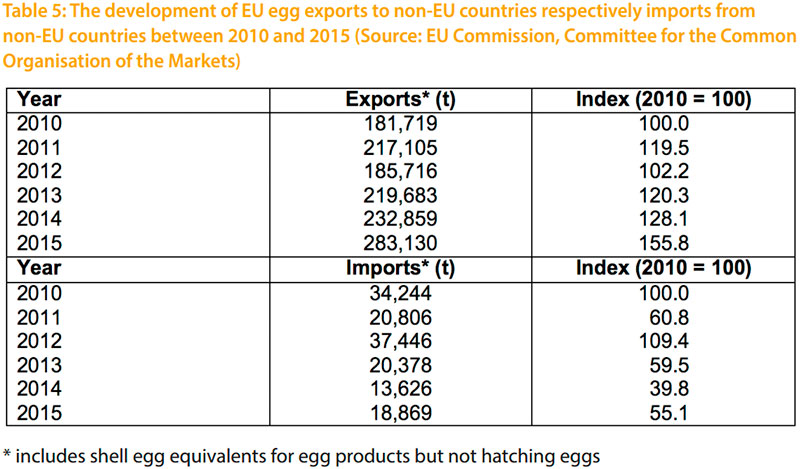
Table 5 shows the development of EU egg exports to non-EU countries respectively EU egg imports from non-EU countries. A closer look at the data reveals the close interdependency between the trade volumes and the implementation of Directive 1999/74/EU. Between 2010 and 2015, egg exports to non-EU countries increased by about 101,000 t or 55.5 %. It was, however, not a continuous increase. The earlier banning of conventional cages in Germany and Austria in 2010 and for the whole EU in 2012 resulted in a decrease of the production volumes. When the transformation to other housing systems was completed, exports increased again. The sharp increase between 2014 and 2015 is a consequence of the oversupply with shell eggs and the rising imports of the USA because of the AI outbreaks in 2015. A similar dynamics show the egg imports. The decreasing self-sufciency in Germany, as the leading egg importing country, made additional imports from non-EU countries necessary. The same steering factor explains the increase in 2012 when all countries had to ban conventional cages. When the transformation was completed and production increased again, imports fell to the average level.
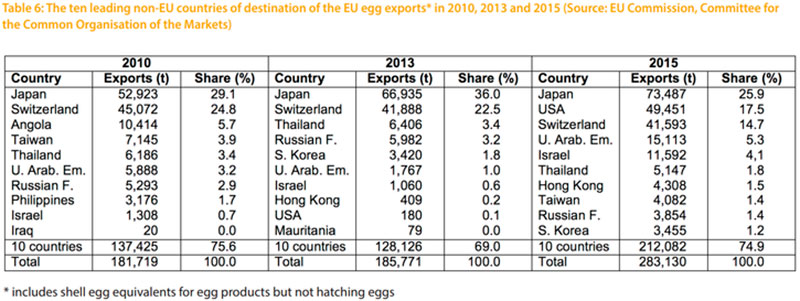
Table 6 shows a remarkable fluctuation inthe composition and ranking of the countries. In 2010, 98,000 t or 53.9 % of the total export volume went to Japan and Switzerland. These two countries ranked also as number one and two in 2013, sharing 58.5 % of the overall exports. In 2015, the USA replaced Switzerland as the second most important country of destination. Because of the much higher total exports, the three leading countries shared 58.1 % of the total export volume. It can be expected that the exports to the USA was a singular event caused by the shortage of eggs for further processing and of egg products resulting from the massive outbreaks of Avian Influenza in the northern Midwest in 2015 (Windhorst, 2016). The AI outbreaks in the USA also led to a considerable increase of the EU exports to the United Arab Emirates and Israel which had in preceding years imported egg products mainly from the USA. Because of the import ban on poultry products from the USA, they had to look for other countries which could step in. Export data for the frst six months of 2016 show that exports to Japan fell considerably, a result of the AI outbreaks in some EU member countries in early 2016 (EU Commission 2016).
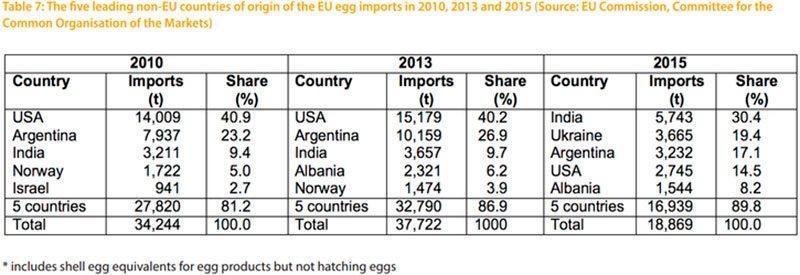
In Table 7, the changes in the composition and ranking of the fve leading countries from which the EU imported eggs and egg products are documented. In 2010 and 2013, the USA and Argentina ranked as number one and two. Together they shared between 74% respectively 77 % of the total import volume. In third place ranked India. All three countries exported mainly egg powder and some eggs for further processing but no shell eggs for consumption. Because of the AI outbreaks and the import ban on poultry products from the USA and the oversupply in the EU, imports decreased considerably. Im ports from India increased and Ukraine became one of the leading countries of origin and could also stabilize its position in the frst half of 2016 as more recent data shows. Imports from the USA further decreased because of the imposed import ban by some member countries.
The preceding analysis revealed that because of the lack of detailed data on the exports and imports of eggs and egg products it is very difcult to present a complete picture of the dynamics, trade patterns and trade flows. Nevertheless, the presented data give a good overview on the present pattern of the foreign trade of the EU with eggs and egg products.
4. New challenges for the EU egg industry
The EU has been one of the innovation centres for intensive, market-oriented egg production. This is not only true for breeding, but also for the development of new technologies in housing systems. The international fairs impressively document the EU´s leading role, i.e. at the EUROTIER in Hanover, the VIV Asia in Bangkok or the IPPE in Atlanta. But criticism regarding the keeping of laying hens in conventional cages also originated in the EU, and the EU is still the only region in which this housing system is prohibited. From the EU, the requirement for alternative housing systems spread to several other countries, i.e. the USA, Canada, Australia and New Zealand. Recently, also in some developing countries, for example in Mexico, food retailers and fast food restaurants announced that they will only list or use eggs produced in alternative housing systems from 2022 or 2025 on. Cage free has become the new magic word.When the implementation of Directive 1999/74/EU was fulflled in 2012, one could have expected that a phase of less criticism would begin. But this was not the case. Very soon, new points of criticism inflamed the discussion regarding modern egg production in large flocks. Three new challenges can be identifed: banning of beak treatment, banning of killing one-day old male chicks and prohibiting animal production at all. It is not surprising that NGOs from Germany, the Netherlands and the United Kingdom are the opinion leaders.
At the moment, Germany seems to be the forerunner regarding the banning of beak treatment in countries with large layer inventories. Beak treatment of laying hens is banned since the second half of 2017 in Austria, but the majority of the hens had already untreated beaks. Some of the leading countries of origin for Germany´s egg imports will have to adjust to the new regulation if they want to remain in the market. Field studies with untreated flocks have shown that herds with white hens are causing lesser problems regarding feather pecking and cannibalism than brown layers. But problems can also show up in white layer herds.
The challenge of identifying the sex of a chick before starting the hatching process or in the early days of hatching cannot be solved satisfyingly at the moment. Several research projects are going on in Canada, the USA, Israel, Germany and some other countries. New technologies have been developed but it is still an open question if these technologies will be able to handle 100,000 hatching eggs per day and with which results. As it seems, some technologies are working on small scale, but they are still too time-consuming and too cost-intensive. Field studies to use the male chicks for meat production have shown that because of the unfavourable feed conversion, the colour and taste of the meat and the limited acceptance of these birds by consumers, this alternative use is obviously not a promising way to solve the problem (Schmidt et al. 2016).
Considering the challenges which the egg industry has to cope with, it can be assumed that egg production in the EU will not grow much in the coming years. Because of this perspective every endeavour should be made to spread the knowledge about the unchallenged role of eggs as the best protein source in human nutrition.
References and data sources
Directive 1999/74/EU: http://eur-lex.europa.eu/LexUriServ/LexUriServ.do?uri=OJ:L:1999:203:0053:0057:EN:PDFEU Commission, Committee for the Common Organisation of the Agricultural Markets. Brussels, November 17th, 2016.
EUROSTAT: ec.europa.eu/eurostat/de/data/database
FAO database: www.faostat.fao.org.
MEG-Marktbilanz Eier und Geflügel. Bonn,various editions.
Schmidt, E., G. Bellof, C. Feneis, K. Damme, K. Reiter (2016) Zweinutzungshühner im Test – Gibt es den Hahn für alle Fälle? DGSMagazin 68 (13): 37-40.
Windhorst, H.-W.: The EU Egg Industry in Transition. London: International Egg Commission 2017.
I want to thank Dr. Aline Veauthier for preparing the maps and graphs of this report, also for reading the whole text and her comments.