
Abstract
The poultry gut microbiome represents gut microorganisms and genomes as well as genes belonging to those microorganisms. Since
the gut microbiome is involved in the regulation of multiple host metabolic pathways, a deep understanding of the relationships between gut microbiome and host should provide new strategies to improve poultry health and productivity as well as poultry meat
safety. In this review, metagenomics techniques currently available are summarised, as well as possible approaches to data analysis.
Furthermore, selected metagenomic studies illustrating how to implement metagenomic projects to find the reasons of changes in
chicken productive performances due to nutritional interventions, to map variations in antibiotic resistance genes and to investigate
the microflora associated to poultry carcasses are shown, along with key technical issues to address in order to promote metagenomics
investigations in poultry science.
Keywords
Metagenomics, next generation sequencing, microbiota, antibiotic resistant genes, meat safety
Introduction
The number of microbial cells and genes in chickens overcome the total of poultry cells. Since the great majority of microbes live in the chicken gut, to understand and exploit the impact of microbes on physiological processes of chickens, content, diversity and functioning of the microbial gut community must be decoded.The collective microbial community inhabiting the chicken gut is named microbiota, whereas the collective genomic content of the microbiota is referred as metagenome.
Furthermore, the ecosystem represented by all the microorganisms (i.e. bacteria, archaea, lower and higher eukaryotes, and viruses) inhabiting the chicken gut, their genes as well as the chicken genes, is defined microbiome (Tremaroli and Bäckhed, 2012). The next generation sequencing (NGS) approaches to characterize the microbiota, the metagenome and the microbiome are different one to the other and details on the available sequencing strategies are provided below.
Metataxonomic
The sequencing-based approach to identify the entire microbiota in a sample is named metataxonomic and refers to sequencing of marker genes followed by assignment of each obtained sequence to a taxonomic level, from phylum to species or even subspecies, using a variety of bioinformatic tools. One of the most general targets for metataxonomic is the hypervariable region in genes encoding the 16S rRNA. The bacterial 16S rRNA gene possesses nine hypervariable regions (V1-V9)Fig 1. Hypervariable regions (V1-V9) in the 16S rRNA
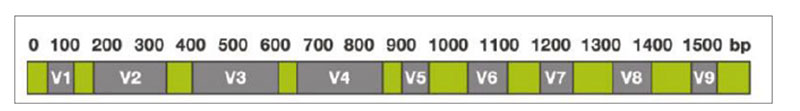 Sequence variations in hypervariable regions allow accurate bacterial taxonomic estimation by comparing against 16S
rRNA gene sequences deposited in public databases, such as GreenGenes, Ribosomal Database Project, SILVA, etc. (Choi et al., 2015). The overall sequencing output of the 16S rRNA is a cluster of nearly identical sequences, referred to operational taxonomic units (OTUs) (Cole et al., 2014).
Sequence variations in hypervariable regions allow accurate bacterial taxonomic estimation by comparing against 16S
rRNA gene sequences deposited in public databases, such as GreenGenes, Ribosomal Database Project, SILVA, etc. (Choi et al., 2015). The overall sequencing output of the 16S rRNA is a cluster of nearly identical sequences, referred to operational taxonomic units (OTUs) (Cole et al., 2014).The representative sequences, which are either the most abundant sequences or sequence with the least distance summation within all sequences in the same OTUs, are then matched to those in a public database to obtain taxonomic classification. In addition to providing taxonomic information, the OTUs provide information on population diversity, indicating richness and evenness of individual species in a sample as alpha diversity (Colwell, 2009).
This information is also used to account for the degree of divergence between different communities or sample types.
Metagenomic
The sequencing based approach to characterize both the metagenome and the microbiome does not target a specific gene, like the 16S rRNA but is shotgun, meaning random on the whole genomic content.Shotgun sequencing is the process of randomly breaking (often by shearing) long DNA molecules (for example, complete chromosomes) and then sequencing the resultant DNA fragments, which each come from a different location in the original DNA molecule (Weinstock, 2012).
Shotgun sequence data provide information on the organisms that make up communities but also information on functional genes in the sample.
Therefore, the current challenge for metagenomic sequencing is to complete the framework associating each specific microorganism with its own gene set.
Besides technical differences between metataxonomic and metagenomic, the goals for any metagenomic project are to understand:
- 1) community composition/structure, including taxonomic breakdown and relative abundance of the various species;
- 2) genic contribution of each member of the community, including number and functional capacity;
- 3) intra-species and/or intra-population gene heterogeneity (Scholz et al., 2012).
Next Generation Sequencing (NGS)
Both metataxonomic and metagenomic have been made possible by the advent of (NGS technologies, also defined as massively parallel sequencing because they allow for millions of sequencing reactions to happen in parallel. NGS technologies can be divided into Second Generation Sequencing (SGS) and Third Generation Sequencing TGS), based on the sequencing process used (Ambardar et al., 2016).The combination of read (i.e., sequence) length and number of reads defines the throughput of each instrument in number of bases per run. When the human genome project started in 1990 using the Sanger sequencing, which is not a massive sequencing strategy, 13 years and 2.7 billion US dollars have been spent to sequence one single human genome, which is about 3 billion base pair, meaning 3 times the chicken genome.
Today, by using the second and third generation of sequencing technologies, 100000 human genomes have been sequenced and each one costs less than 1000 US dollars. Nevertheless, the bottleneck is now computational and data storage as well as data interpretation.
Data analysis strategies
The simplest way to analyse the metagenome is to compare the obtained reads (i.e., sequences) to sequence databases and calculate the statistical significance of matches to identify taxonomical and functional entities (e.g. https://blast.ncbi. nlm.nih.gov).Alternatively, assembly algorithms can be used to reconstruct short reads into a sequence contig((set of DNA fragments with known sequence), which is a set of overlapping sequences representing the contiguous DNA fragment (Mende et al., 2012; Thomas et al., 2012).
Although obtaining a complete individual genome from metagenomic sequences is still challenging, the data collected are sufficient to characterize the major functions of the microbial communities as well as to identify their taxon, by assigning to public genome reference databases (Howe et al., 2014; Nielsen et al., 2014). Even though current computational analysis strategies for metagenomic data rely largely on comparisons to reference genomes, they represent only a fraction of what we know and therefore limit our ability to segregate metagenomic data into coherent biological entities and fail to describe previously unknown species, phages and modules of genetic variation within microbial species(Nielsen et al., 2014).
A possible alternative is the de novo assembly (i.e., assembly without a reference) of genomes from complex metagenomic data, although it is inherently difficult due to the many sequence ambiguities that confuse the assembly process. Hence, a typical metagenomic assembly will result in a large set of independent contigs that are not easily aggregated into biological entities. A good example of identification and assembly of genomes in complex metagenomics samples without using reference genomes has been described by Nielsen et al. (2014). They clustered the metagenomic data into groups of genes with similar abundance named CAGs. Since the genomes of bacteria contain more than 700 genes, the CAGs with more than 700 genes are considered metagenomic species, whereas the CAGs with less than 700 genes are identified as genes for protein of phages, CRISP associated genes relevant in the immune system against foreign nucleic acids, restriction endonucleases, glycotransferases, etc.
How many samples should I include in a metagenomics study and what should be the sequencing depth?
Each metagenomic study includes different steps grouped in a wet lab part and in a dry lab part (Table 1).Table 1. Overall description of the steps included in a metagenomic study
Wet lab part
- Sample collection, transport and storage
- Sample handling
- DNA or RNA extraction and quantification
- Library preparation and quantification
- Sequencing
- Quality control of the sequences
- Trimming of indexes and adaptors
- Bioinformatics analysis of the sequences
- Biostatistic analysis of differences between sequencing results of different samples
This strain was then used by the authors as benchmark to assess the suitability of their method to identify the species.
Even though only 0.3% of the sequence reads (DNA fractures with known sequence) in the 19 selected samples originated from B. animalis, 95% of the B. animalis reference genes were captured into one specific metagenomic species. At a sequencing depth of 700000 bp and even 200000 bp, 97% of the B. animalis genes are captured; however at least 18 samples are needed to achieve the same level of specificity meaning that the number of samples to test is more critical than sequencing depth.
Concerning the sequencing depth, Ni et al. (2013) state that the genome of a single species can be accurately assembled from a complex metagenomic dataset when it shows at least 20-fold coverage, meaning that there are at least 20 fold sequence data covering that specific genome.
According to their calculation at least 7Gbp (i.e., 7×10⁹ bases) of sequencing output is required to enumerate the gene contents of prokaryotes with relative abundance of more than 1% in a microbiome. This does not mean that in all the experiments this depth of sequencing must be used but lower depth would map species and genes with relative abundance higher than 1%. In terms of costs, to sequence each sample at 7Gbp means to spend something between 270 and 300 Euro/sample.
To include 18 samples/test in a metagenomic poultry study means a lot of money. Besides, birds belonging to the same group, either control or treated one, and reared within the same farm might be considered less prone to variability in comparison to humans as addressed in the study by Nielsen et al. (2014). Therefore, 9 samples/treatment might be considered enough to test. However, that sample number should be really decided case by case according to the metagenomic project goals.
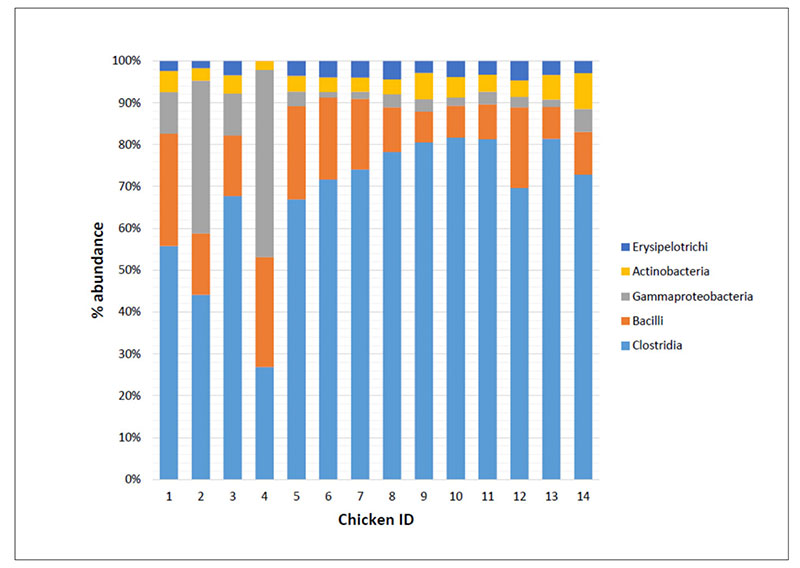
As an example Figure 2 shows that the bacteria classes identified in the caeca contents of chickens tested at day 1 (IDs 1 to 4) and at the end of the rearing period (i.e., 41 days) within both a control group (IDs 5 to 9) and a treated group (IDs 10 to 14) and display differences in their mean relative frequency of abundance in individual chickens. Therefore, decreasing too much the number of samples to investigate in a trial might negatively impact on the detection of the variability between samples.
Fig 2. Mean relative frequency of abundance (% abundance) of most represented bacterial classes in caeca contents of chickens belonging to the same trial and tested at Day 1 (chicken IDs
1-4) and 41 in a control (chicken IDs 5-9) and a treated (chicken IDs 10-14) group.
Metagenomic sequencing to interpret changes in chicken productive performances due to nutritional interventions
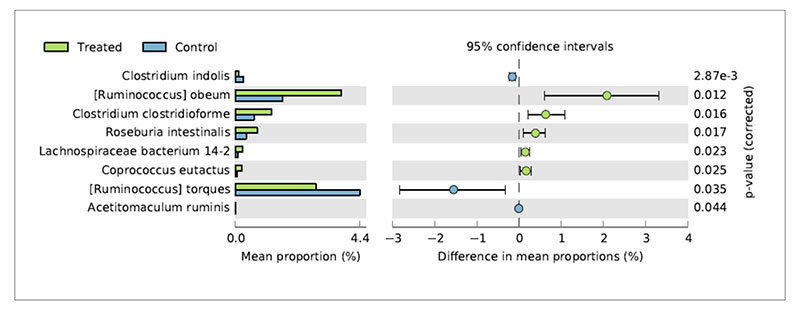
Metagenomic studies can help to interpret the reasons of changes in chicken productive performances associated to nutritional interventions. De Cesare et al. (2017a) observed a significant beneficial effect of the dietary supplementation with Lactobacillus acidophilus D2/CSL (CECT 4529) at the recommended dietary dosage of 1×10⁹ cfu/kg feed on (1) broiler body weight gain between 15-28 days; (2) improved feed conversion rate in the overall rearing period (i.e., from 0 to 41 days); (3) a lower incidence of pasty vents in chickens treated with the probiotic. To explain these observations caecum contents were sampled from treated and untreated birds and submitted to metagenomic shotgun sequencing to look at both taxonomic composition as well as functional genes in both control and treated samples. The relative abundance of Lactobacillus acidophilus in the caeca of treated chickens was comparable with that of the control group probably because the colonization preference of the administered strain is the crop and the small intestine. On the other hand, microbial species producing butyric acid, such as Ruminococcus obeum, Clostridium clostridioforme, Roseburia intestinalis, Lachnospiraceae bacterium 14-2T and Coprococcus eutactus at 41 days displayed a significantly higher relative frequency of abundance in the treated birds in comparison to the control group (Figure 3).Fig 3. Bacterial species significantly differed in chickens treated with L. acidophilus (Treated)
in comparison to the untreated birds (Control) at 41 days.
 This result suggests that besides the lack of colonization of Lactobacillus acidophilus in broiler caeca, the metabolic activity of the supplemented probiotic positively affected species producing butyric acid by a cross feeding mechanism.
Concerning the lower incidence of pasty vents in the chickens treated with the probiotic it was associated to lower abundance of Ruminococcus torques in their caeca. Indeed, R. torques is known to degrade the gastrointestinal mucin, representing a carbon and energy source for intestinal microbiome. It has been estimated that 1% of colonic microbiome is able to degrade host mucin using enzymes (e.g. glycosidases and sulfatases) that can degrade the oligosaccharide chains. Moreover, degradation of mucin is regarded as a pathogenicity factor, since loss of the protective mucus layer may expose gastrointestinal tract cells to pathogens. Therefore, the higher abundance of R. torques in the control group was probably related to the higher incidence of pasty vent in the control group in comparison to the treated group.
In relation to the metabolic functions, the caecum contents collected in the treated group showed a significantly higher level of β-glucosidase (Figure 4).
Fig 4. Mean relative frequency of abundance (% abundance) of the KEGG functions showing P < 0.05 between chickens treated with L. acidophilus (Treated) in comparison to the untreated
birds (Control) at 41 days.
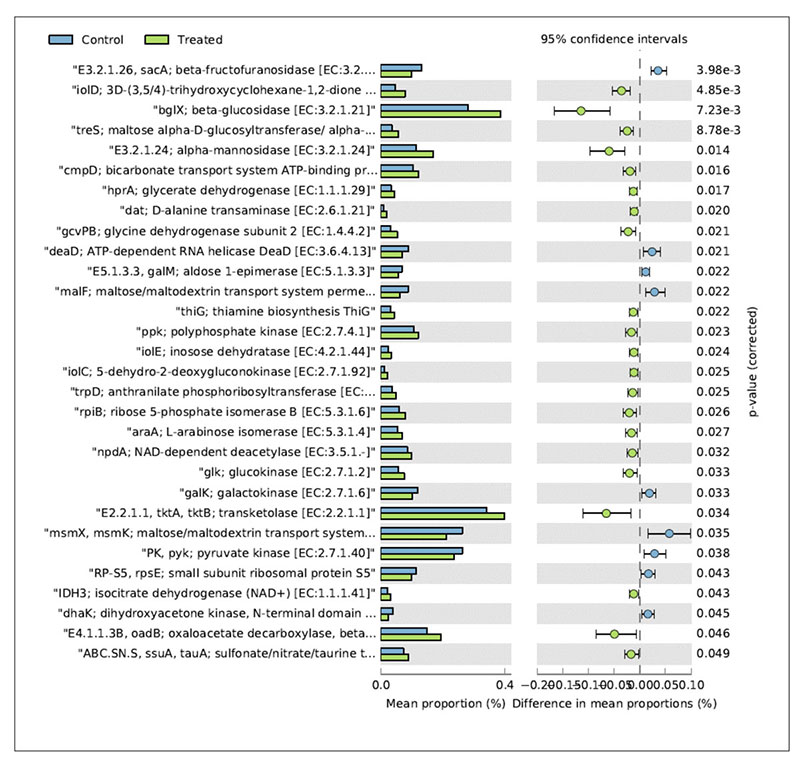 This enzyme contributes to the hydrolysis of glucose monomers from non-starch polysaccharides (e.g., cellulose, β-glucans), playing an important role in the fermentation of undigested carbohydrates and, ultimately, in animal performance and health. In particular, β-glucosidase (β-glucoside glucohydrolase; EC3.2.1.21) hydrolyzes alkyl- and aryl-β-glucosides, as well as diglucosides and oligosaccharides, to release glucose and an aglycone.
 It also hydrolyzes isoflavonal glycoside conjugates into isoflavone aglycones, such as genistein, daidzein, and glycitein. These aglycones hydrolyzed by β-glucosidases from intestinal microorganisms are readily absorbed across the villi of the intestine, possess greater bioavailability than the corresponding glycoside conjugates and a wide range of biological properties, such as antioxidant and anti-tumor activities.
Metagenomic mapping of variations in antibiotic resistance genes
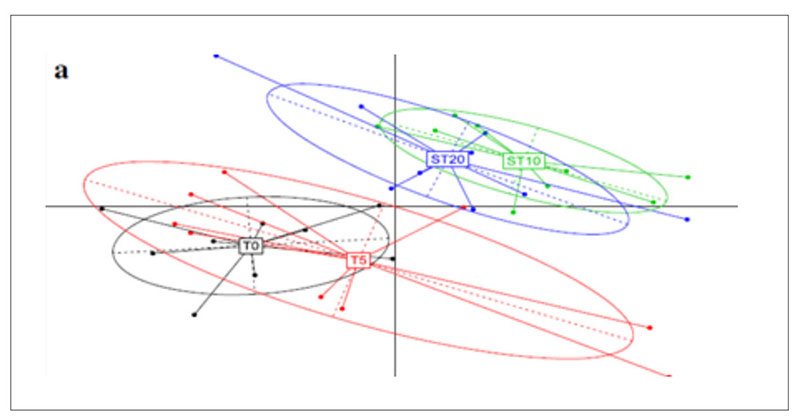
A further application of metagenomics concerns the investigation of antibiotic resistance genes (ARGs) in chicken guts, poultry faeces and farm environments (Xiong et al., 2018). Animal faecal microflora harbours a vast reservoir of ARGs that could be acquired by human commensals and pathogens. Furthermore, antibiotic resistant bacteria and ARGs in animal excretion may be transported into the environment via manure application, leakage, runoff and airborne particulate matter, globally contributing to the aggregation of resistance in the environment. Xiong et al.(2018) applied metagenomic sequencing to investigate variations in ARGs and bacterial host abundance in the faeces of broilers treated for 5 days with a low dose (0.2 g/L) and a therapeutic dose (2 g/L) of chlortetracycline in the drinking water. The results obtained showed that therapeutic dose of chlortetracycline inhibited multidrug resistance genes (i.e., mdtA, mdtC, mdtK, ompR, and TolC) and promoted the abundance of tetracycline resistance genes (tetA and tetW). The metagenomic analysis was performed at 8.7 Gbp of reads for each sample and showed that the resistome is quite similar in all tested groups and is established in the poultry fecal metagenomes also in absence of antibiotic exposure.However, the principal component analysis (Figure 5) shows a clear shift in the antibiotic resistance subtypes over time, meaning between T0=27 days of rearing and starting time of the treatment; T5=37 days of rearing and end of the treatment; ST10= 42 days of rearing and 5 days after the end of the treatment; ST20=47 days of rearing and 15 days after the end of the treatments. Among the most abundant genes, which were multidrug resistance genes, aminoglycoside and tetracycline resistance genes, the tetracycline resistance genes (tetA and tetW) significantly increased in a dose dependent manner in both low dose and therapeutic dose groups 15 days after the end of the treatment, while several multidrug resistance genes significantly decreased in the therapeutic dose group during the treatment.
Fig 5. Principal component analysis of ARG subtypes over the course of chlortetracycline administration. T0=27 days of rearing and starting time of the treatment; T5=37 days of rearing
and end of the treatment; ST10= 42 days of rearing and 5 days after the end of the treatment;
ST20=47 days of rearing and 15 days after the end of the treatments.
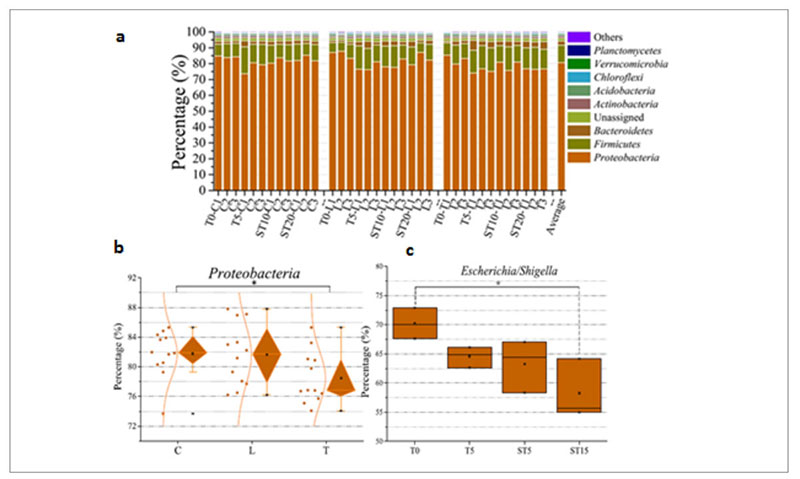
At taxonomic level, the metagenomic data showed that Proteobacteria was the predominant phylum in the whole population (Figure 6a) but the therapeutic dose of antibiotic decreased its abundance from 83% in the control and low dose group up to 75% in the therapeutic dose group (Fig. 6b), mainly because there was a drop of the Escherichia/Shigella genera from 70% before the treatment to 58% after the treatment (Fig. 6c).
Fig. 6. Phyla identified in the samples tested among which Proteobacteria is the predominant one (a). Decrease of Proteobacteria among the
different groups of samples: (control (C); low dose (0.2 g/L) (L); therapeutic dose (2 g/L) (T)) (b). Decrease of Escherichia/Shigella over time in
the therapeutic dose group.
 Since the metagenomic data indicated that Escherichia wasthe major host for the multidrug resistance genes at all sampling times, the inhibition of Escherichia in the group treated with the therapeutic dose of chlortetracycline was the primary reason for the decrease of multidrug resistance genes in that group, while the emergence of tetracycline resistance genes was due to the emergence of a new set of bacteria hosting those genes, including Bifidobacterium during and after the end of the treatment. Overall, these data indicate that the changes in the structure of antibiotic-induced faeces microbial communities accompany changes in the abundance of bacterial hosts carrying specific ARGs in the faeces microbiota and findings like these should contribute to optimize therapeutic schemes for the effective treatment of antibiotic resistant pathogens in poultry farms.
 Metagenomic investigation of poultry carcasses
Metagenomic investigations of food microbiota have been less reported in the literature, perhaps because microbial communities of food are generally considered to have a low richness in terms of diversity (Kergourlay et al., 2015).However, the development of NGS technologies and their application in the field of food ecosystems revealed that these communities are perhaps richer than expected and that some of them might play a yet unknown role (Kergourlay et al., 2015).
De Cesare et al. (2017b) applied metagenomics sequencing to preliminary investigate the microbiological profile of chicken carcasses collected from animals fed with different diets. A total of 15 carcasses were collected at the slaughterhouse at the end of the refrigeration tunnel from chickens reared for 35 days and fed with a control diet, a diet supplemented with 1500 FTU/kg of commercial phytase and a diet supplemented with 1500 FTU/ kg of commercial phytase and 3g/kg of inositol. Sequence analysis showed that Proteobacteria and Firmicutes represented more than 98% of whole bacterial populations associated to carcass skin in all groups but their abundances were different between tested groups. Moreover, Moraxellaceae and other degradative bacteria showed a significantly higher abundance in the control compared to the treated groups. At species level, Clostridium perfringens showed a relative frequency of abundance significantly higher in the group fed with phytase and Salmonella enterica in the group fed with phytase plus inositol. Although it was not possible to make a correlation between what the chicken ate and the composition of their microflora, this study is one of the first example of metagenomic sequencing of chicken breast and neck skin sampled according to what it is requested in the EU Regulation 2073 on microbiological criteria on foodstuffs and showed statistically significant differences between the metagenomes associated to carcasses obtained from chickens fed with different diets.
In terms of food regulations, Yang et al. (2016) recognize that metagenomic approach has a great utility for investigating the ecology of foodborne pathogens in the food ecosystems but there are still barriers to use shotgun metagenomics for their identification and quantification for regulatory purposes because of a possible misclassification of the microorganisms inherent to the read length; because there are problems to get deep coverage of the pathogenic organisms in the sample due to the presence of other prokaryote and eukaryote within the sample; and also because a comprehensive database containing all possible pathogens does not exist. However, at international level there are research projects like COMPARE (www.compare-europe.eu) which are investigating how to effectively solve all these technical gaps. Besides, there are research projects like CIRCLES (https://circlesproject.eu/) which aims to support the changes needed for sustainable, resilient, competitive, diverse, responsible and inclusive food systems, including chicken meat, by assessing the potential of microbes associated to poultry at whatever level using shotgun metagenomics.
Conclusion
In the literature there are more and more studies addressing the role of the gut microbiome in chicken productivity and health as well as poultry meat safety. Even though our knowledge of the gut microbiome composition, its metabolic functions and influence on animal health is far from complete, metagenomic sequencing seems to be one of the most effective research strategies to fill this gap of knowledge.
References
AMBARDAR, S., GUPTA, R., TRAKROO, D.,
LAL, R., VAKHLU, J. (2016) High Throughput
Sequencing: An Overview of Sequencing
Chemistry. Indian Journal of Microbiology,
56(4):394–404.
CHOI, K. Y., LEE, T. K. and SUL, W. J. (2015) Metagenomic analysis of chicken gut microbiota for improving metabolism and health of chickens—a review. Asian-Australasian Journal of Animal Sciences 28: 1217.
COLE, J. R., WANG, Q., FISH, J. A., CHAI, B., MCGARRELL, D. M., SUN, Y., BROWN, C. T., PORRAS-ALFARO, A., KUSKE, C. R. and TIEDJE, J. M. (2013) Ribosomal Database Project: data and tools for high throughput rRNA analysis. Nucleic Acids Research 42(D1): D633-D642.
COLWELL, R. K. (2009) Biodiversity: concepts, patterns, and measurement. The Princeton Guide to Ecology, 257-263.
DE CESARE, A., SIRRI, F., MANFREDA, G., MONIACI, P., GIARDINI, A., ZAMPIGA, M. and MELUZZI, A. (2017a) Effect of dietary supplementation with Lactobacillus acidophilus D2/CSL (CECT 4529) on caecum microbiome and productive performance in broiler chickens. PloS One 12: e0176309.
DE CESARE, A., PALMA, F., LUCCHI, A., PASQUALI, F. and MANFREDA, G. (2017b) Microbiological profile of chicken carcasses: a comparative analysis using shotgun metagenomic sequencing. Italian Journal of Food Safety 7: 6923, 62-67.
HOWE, A. C., JANSSON, J. K., MALFATTI, S. A., TRINGE, S. G., TIEDJE, J. M. and BROWN, C. T. (2014) Tackling soil diversity with the assembly of large, complex metagenomes. Proceedings of the National Academy of Sciences USA 1: 4904-4909.
KERGOURLAY, G., TAMINIAU, B., DAUBE, G. and VERGÈS, M. C. C. (2015) Metagenomic insights into the dynamics of microbial communities in food. International Journal of Food Microbiology 213: 31-39.
MENDE, D.R., WALLER, A.S., SUNAGAWA, S., JARVELIN, A.I., CHAN, M.M., ARUMUGAM, M., RAES, J. and BORK, P. (2012) Assessment of metagenomic assembly using simulated next generation sequencing data. PLoS One 7: e31386.
NI, J., YAN, Q., and YU, Y. (2013) How much metagenomic sequencing is enough to achieve a given goal?. Scientific Reports 3: 1968.
NIELSEN, H. B., ALMEIDA, M., JUNCKER, A. S., RASMUSSEN, S., LI, J., SUNAGAWA, S., ET AL. (2014) Identification and assembly of genomes and genetic elements in complex metagenomic samples without using reference genomes. Nature Biotechnology 32: 822-828.
SCHOLZ, M. B., LO, C. C. and CHAIN, P. S. (2012) Next generation sequencing and bioinformatic bottlenecks: the current state of metagenomic data analysis. Current Opinion in Biotechnology 23: 9-15. THOMAS, T., GILBERT, J. and MEYER, F. (2012) Metagenomics-a guide from sampling to data analysis. Microbial Informatics and Experimentation 2: 3.
TREMAROLI, V. and BÄCKHED, F. (2012) Functional interactions between the gut microbiota and host metabolism. Nature 489 (7415), 242.
WEINSTOCK, G. M. (2012) Genomic approaches to studying the human microbiota. Nature 489 (7415): 250.
YANG, X., NOYES, N. R., DOSTER, E., MARTIN, J. N., LINKE, L. M., MAGNUSON, R. J., YANG, H., GEORNARAS, I., WOERNER, D. R., JONES, K. L., RUIZ, J., BOUCHER, C., MORLEY, P. S., and BELK, K. E. (2016). Use of metagenomic shotgun sequencing technology to detect foodborne pathogens within the microbiome of the beef production chain. Applied and Environmental Microbiology, 82(8), 2433-2443.
XIONG, W., WANG, Y., SUN, Y. et al. (2018). Antibiotic-mediated changes in the fecal microbiome of broiler chickens define the incidence of antibiotic resistance genes. Microbiome, 6: 34.