
Summary
In this paper, possible causes of elevated mortality rates between egg production farms are discussed
in general, based on published literature and personal observations. Data from 74 U.S. flocks of a
single strain (LSL Lite) were used to illustrate the range of mortality which may be encountered in
practice. Average results per farm for 9 farms with at least three flocks each are shown in Table 11.
The remaining 19 flocks were kept on farms with only one or two flocks of LSL Lite during the years
covered in this study.

Introduction
“Every flock of chickens has an inherent mortality rate and a pattern of mortality associated with age. Management programs can rarely reduce these basic levels. In some strains, this level may be as low as 0.05% per week and in others as high as 0.20% per week. Superimposed upon this “background” level are additional deaths attributable to many management problems and disease. These problems and disease will elevate this inherent level to the levels we experience in our commercial flocks today – from minor increases to a disease epidemic which may decimate an entire flock.” (Bell, 1999) This article has two objectives: (1) to describe the more important factors which have an effect on mortality in commercial layer flocks in general and (2) to discuss in more detail recent experiences in the U.S. with the Lohmann LSL-Lite strain and the subject of mortality and/or livabilityHistorical Perspective
Published data on the subject of laying flock mortality are limited before the 1950s in the context of this issue. Since then, management methods used and the performance of laying stock used have evolved into a completely different industry. University of California studies of mortality trends in laying hen flocks are available back to 1925, but the earlier data refers to very small (<2000 hens) farms. Mortality totals and rates were based upon the entire multi-age farm various management practices (intensive culling all-pullet flocks) will have distorted the actual levels of mortality relative to today’s rates. Figure 1 illustrates these records for a 100-year California study layer flock performance economics.Figure 1: Annual mortality of laying hens in the U.S. 1925 to 2010
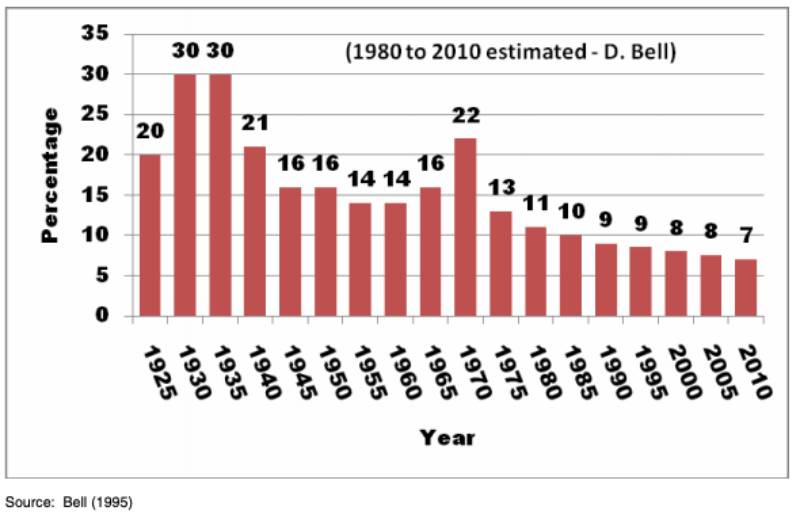
More recent studies beginning in the early 1970s have demonstrated a marked reduction in mortality rates from the 0.25%/week level at the beginning of this period to an average 0.05% to 0.10%/week level today. Much of this has come about because of genetic improvements in most strains. Another fraction has been due to changes in the proportions of the various strains being used. And finally, management decisions have been responsible for the remainder of the improvements. The following discussion will discuss many of these factors and place them in their proper context.
Age and Cycle of Production
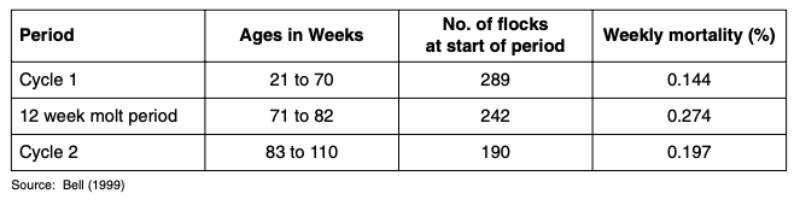
The relationship of age to mortality rates and total mortality is probably the most predictable of the many factors to be discussed in this paper. However, the increase with age is not the same for all strains and it can be increased or decreased under the conditions described. In general, most of today’s popular strains exhibit an increasing pattern of rate of mortality during the first cycle of production. At the time of molt initiation (depending upon the severity of the molting method), mortality rates will increase for several weeks and then fall back to a lower level for the remainder of the second cycle. A 1997/98 study of 289 U.S. layer flocks showed the following results for the first and second cycles of egg production and the molting period.Table 1: Weekly mortality in different egg production periods
Weekly mortality of LSL-Lite flocks from 20 to 60 weeks of age
As shown in the following figure 2, average weekly mortality rates of the 74 LSL Lite flocks during cycle one began at 0.13% to 0.15% levels and then dropped to about 0.10% for 4-5 weeks. From 30 to 60 weeks of age, the mortality rate increased almost linearly along a straight regression line at the rate of +0.0022% per week. Projections of this trend to 80 weeks of age result in a 0.23% estimated rate of mortality at 80 weeks of age (prior to molt).Cumulative mortality by age to 60 weeks of age
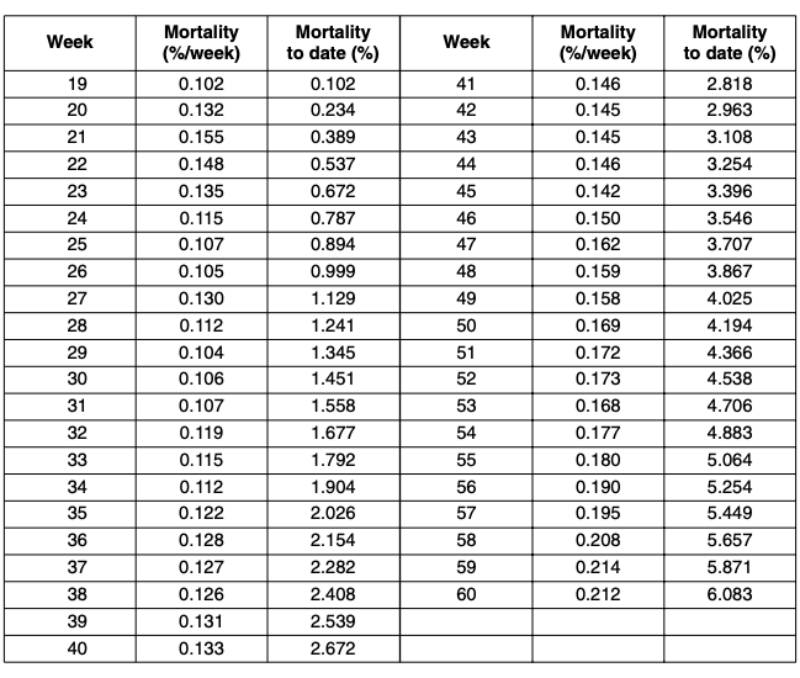
Accumulated mortality rates follow an almost perfect straight line regression. Each additional week increases total mortality by 0.14%, which would project total mortality to about 8.5% by 80 weeks of age (Figure 3). Extrapolation from the rate of increase after 45 weeks of age suggests that total mortality to 80 weeks may be closer to 10%. Table 2 lists the average weekly and total mortality experienced for the 74-flock sample. These areFigure 2: Weekly mortality rates to 60 wks of age for 74 LSL-Lite flocks
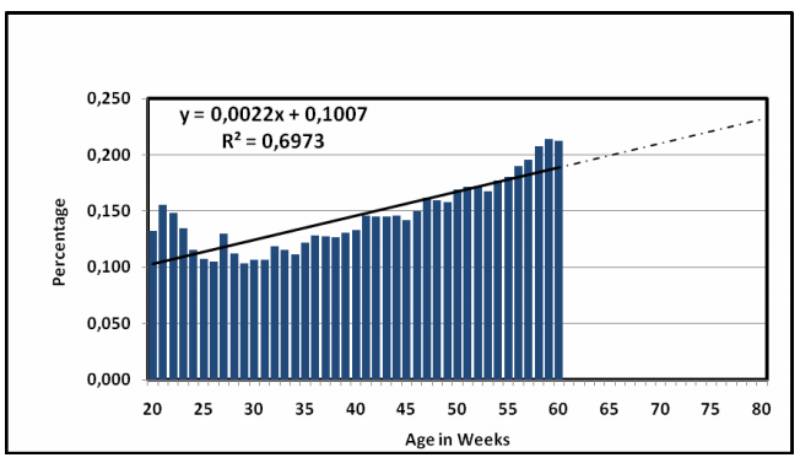
Figure 3: Total mortality to 60 weeks of age of 74 U.S. flocks of LSL-Lite
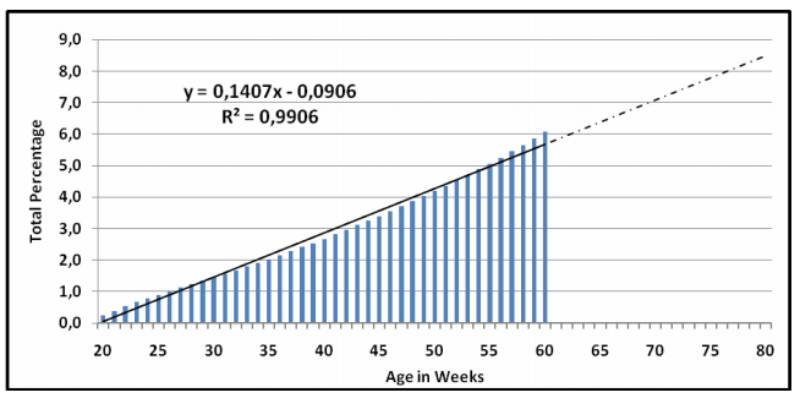
Table 2: Weekly and cumulative mortality to 60 weeks of 74 LSL-Lite flocks age
Best and Poorest Flocks
One of the more important objectives of this report is to demonstrate the full range of results which exist on commercial egg producing farms. Table 3 lists the best and poorest 5 individual flocks and the best and poorest 25% of the 74 flocks, with actual averages and the Lohmann standard for comparison. The average single-age flock consisted of 80 thousand layers at the point of housing, i.e. this study included approximately 6 million layers. Flock size varied between 38,000 for the smallest 25% and 138,000 for the largest 25% of all flocks, with no obvious relation to livability. It is interesting to note that both the top 5 and top 25% of the flocks had lower rates of mortality than the breeder’s standard for this age period. The best 5 flocks had a 97.4% livability result – a remarkable achievement. The range of results reported here is not unusual for studies of this kind. It provides us with achievable targets – opportunity for much improvement over the average, especially for the poorer managers.Table 3: Differences in livability to 60 weeks, weekly and cumulative mortality
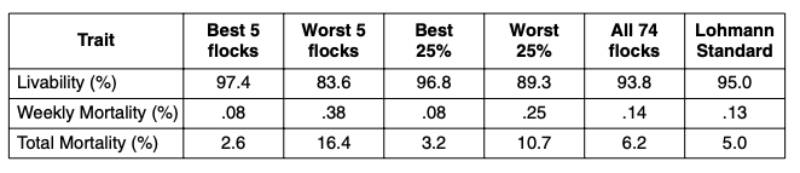
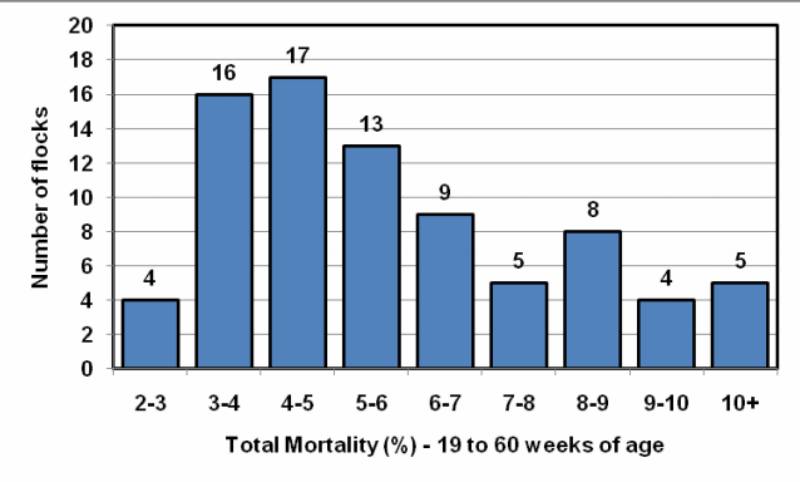
Figure 4 demonstrates the different mortality totals for the 74 flocks in this study. Twenty flocks (27%) had less than 4% morality to 60 wks of age.
Figure 4: Distribution of cumulative mortality from 19 to 60 weeks of age for 74 U.S. flocks
of LSL Lite
Strain Differences
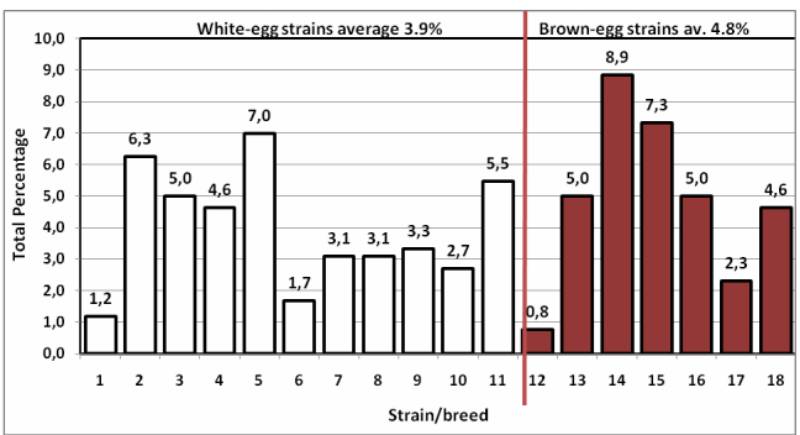
Although strains and breeds perform differently relative to mortality, the author does not have sufficient data from enough commercial flocks to make satisfactory comparisons. Therefore, this discussion will be based on the recently (2011) published results from the 38th North Carolina Layer Performance and Management Test authored by Dr. Ken Anderson at NC State University. Hatching eggs for this study were received from all major breeders, the pullets were raised in common rearing facilities and maintained as adults for two cycles of egg production. Management for all groups is comparable so that performance differences are attributable to strain or breed. Figure 5 illustrates the differences in total mortality for each of the 11 white-egg and 7 brown-egg strains. Individual strains experienced two and three times the amount of mortality as others. Whiteegg strains lost 3.9% of their birds by 60 weeks of age compared to 4.8% for the brown-egg strains. Obviously, strain selection is based upon multiple performance factors, and mortality is only one of manyFigure 5: Strain mortality totals to 60 wks. of age (all strains) in NC Test
Mortality Patterns in Various Strains
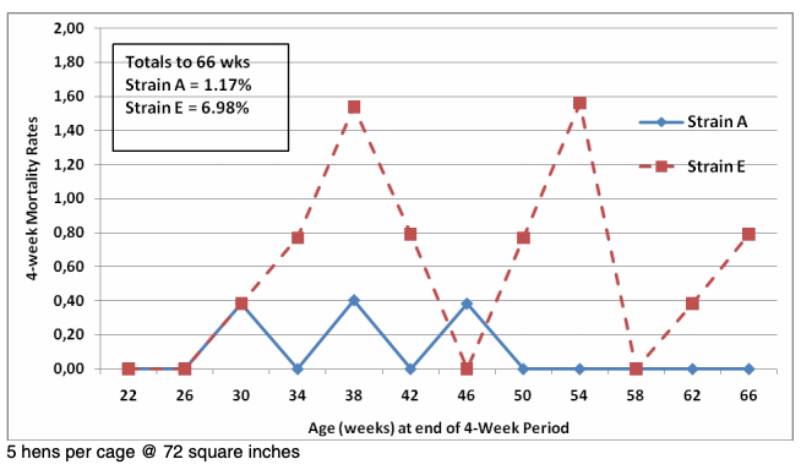
Most discussions of mortality in chicken flocks refer to hen-day or hen-housed data. Current weekly mortality should be based upon the current count of chickens. Farm managers have to focus on current flock performance to identify and solve acute problems as early as possible. Hen-housed mortality, on the other hand, is a better measure to compare total losses in subsequent flocks. The problem with total mortality is that this measure ignores when the birds died – an important piece of information. A 5% total loss means two different things if they die early in their productive cycle or just before sale. Birds that die at earlier ages will obviously lose more on hen-housed production. Some authors have suggested the average number of days alive during the production period as a more meaningful measure of livability.Figure 6 compares the pattern of mortality for the two flocks with the highest and lowest total mortality in the 38th North Carolina Performance Test, based upon 4-week periods.
Environmental Effects – Temperature and Season
Studies relating temperature to mortality are rare because of the small numbers of birds involved in controlled experiments. Climate chambers are few in number and their capacity is usually limited to less than 100 birds each – too few to analyze the relationship of mortality to temperature. For this reason, observations of mortality records from multiple commercial flocks are a better way of determining this relationship. Field observations from different production farms, however, are subject to many uncontrolled sources of variation and may raise a number a questions, e.g.: was the recorded temperature representative for the whole poultry house, to what extent were air quality and ventilation rates affected, and what temperature patterns were being used? U.S. studies of hundreds of flocks housed in controlled environment buildings show only slight effects of normal temperatures or season on mortality, probably because the differences in average housing temperature observed between months were very small. As shown in Table 4, this temperature difference amounted to only 5 degrees F or 3 °C. This illustrates the excellent temperature control systemsFigure 6: Different mortality patterns in 4-week periods for two White Leghorn strains in the
38th North Carolina test 2011
being used on commercial farms today, but it says nothing about the accuracy of the measurements or the quality or the uniformity of the air. The house temperature in this study averaged 76.1 degrees F (24.5 °C) with a monthly range from 74.2 to 79.5 F (23.4 to 26.4 °C).
Seasonal and Temperature Effects on Mortality
Table 4: Weekly mortality (%) by month of lay for 368 first cycle white-egg flocks; U.S. data
for two time periods (1993-94 and 2002-05).
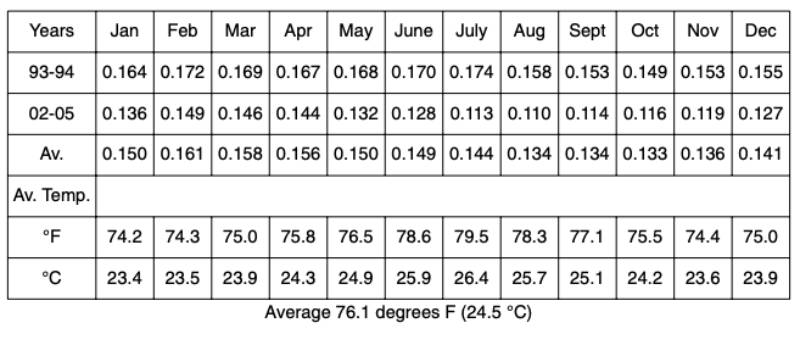
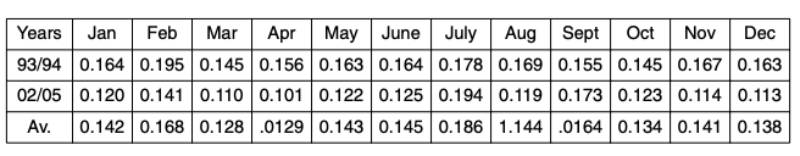
Table 5: Weekly mortality by month of housing (at 18-20 weeks of age)
Management Effects – Cage and Housing Density
One of the more documented factors which affect mortality is cage or housing type and density. Very large differences in mortality are associated with different housing types and, within cage systems, the addition of a single bird. Dozens of well-designed experiments have repeatedly shown from 2.6% to 6.5% increases in annual mortality when a 4th hen is added to a three-hen cage or a 7th hen to a six-hen cage (and other combinations as well). Tables 6 and 7 summarize 52 experiments from the University of California from 1960 to 1994 using four different cage sizes.Table 6: Higher mortality due to increased bird density per cage
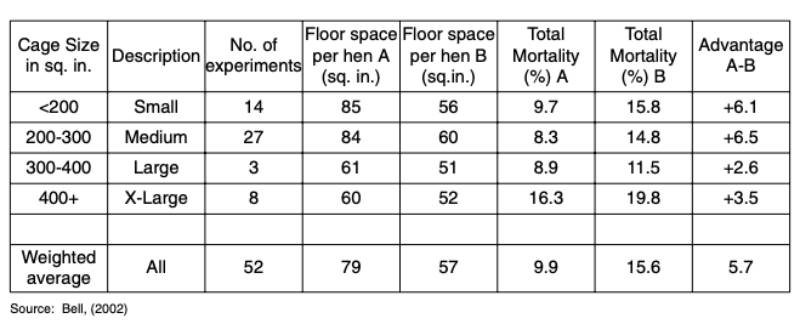
Table 7: Summary of Regression Analyses
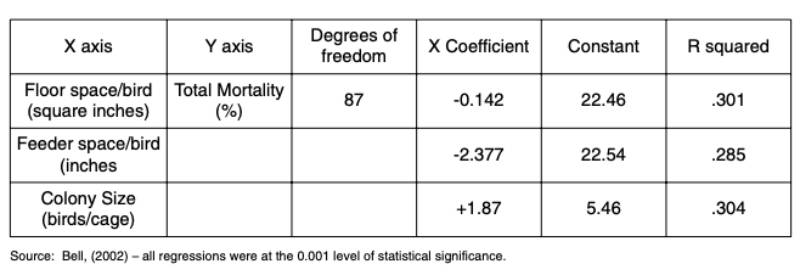
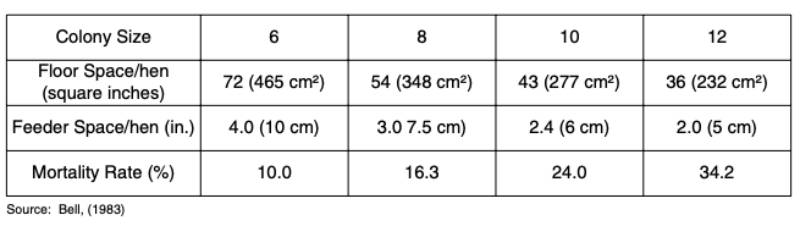
Table 8 documents the effects of increasing bird density in a popular cage size (24 x 18 inches, 60 cm wide x 45 cm deep).
Table 8: Total Mortality with increasing cage density: 6, 8, 10 and 12 hens per cage
As more and more alternative housing types are being used in the U.S., egg producers must be careful in applying their selection criteria. Table 9 shows statistics for total mortality in five housing types, summarized in a CEAS report (2004).
Table 9: Total mortality in various housing systems (EU 2001-2003)
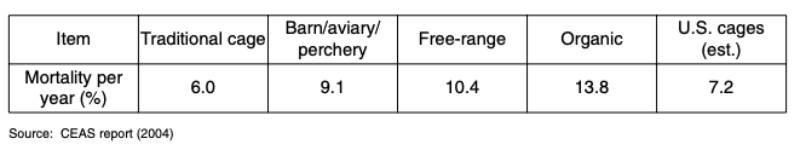
Agra CEAS (2004) summarized results from studies in three EU countries with enriched or furnished cages. Details about the different designs were not described in this report, but total mortality was low and very similar in these countries: 5.4% in Sweden (without beak trimming), 4% in Belgium and the UK (with beak treatment).
Management – Effects of Beak Trimming
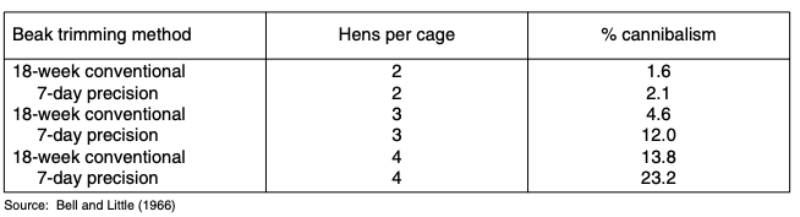
Beak trimming to control cannibalism has been shown to reduce mortality in laying flocks. Different methods of trimming result in more or less control of mortality due to cannibalism. In Experiment (1), University of California research in the early 1960’s compared two different beak trimming methods (7 days vs. 18 weeks) at three different cage densities (2, 3, 4 hens per 12” x 18” cage). Losses were separated into three categories: cannibalism, other causes, and culling (less than 1% were culled). Table 10 lists the mortalities due to cannibalism; the differences were statistically significant. The differences in mortality, in turn, resulted in significantly different hen-housed egg production. Mortality was higher with precision beak trimming at 7-days, and the disadvantage of early beak trimming in terms of cannibalism became more pronounced if combined with increased cage density.Table 10: Effects of beak trimming method and cage density on % cannibalism
In a second experiment, Bell (1996) compared no beak trimming with traditional beak trimming at 7- weeks, using a strain of birds known for low mortality rates. Overall mortality averaged only 0.10% per week in this experiment, but the non-trimmed birds exhibited a 40% higher rate of mortality than their trimmed sisters within the same house (4.73% vs. 3.39%). As shown in Figure 7, the nontrimmed birds had higher mortality rates in seven of the ten 4-week periods.
Figure 7: Long-term mortality benefits from beak trimming
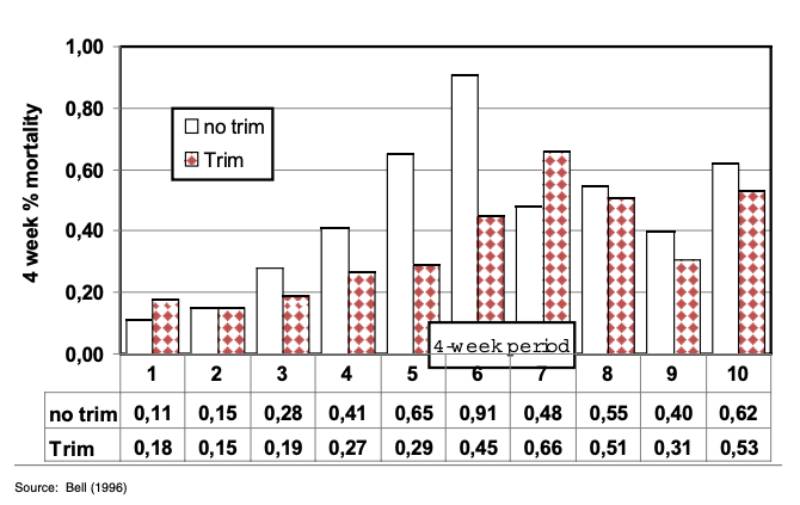
Table 11: Farm to farm comparisons – only LSL-Lite flocks
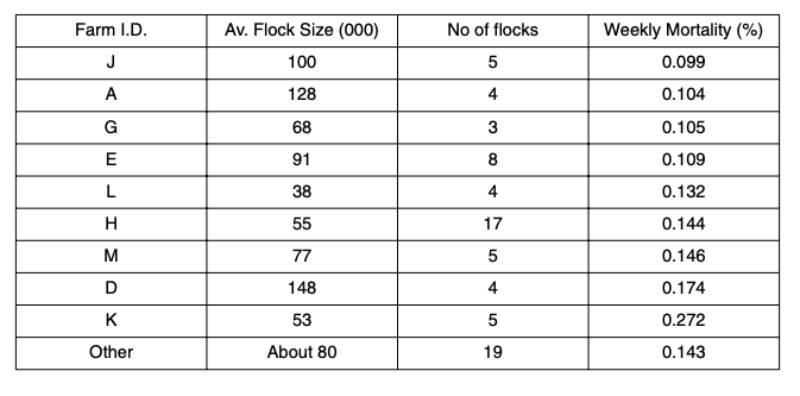
Table 11 shows the wide range of mortality between farms attributable to many of the factors discussed throughout this article. Within this fairly small group of egg producers annual mortality ranged from 0.099% to a high of 0.272% per week – a 2.7 times higher rate, without strain being a factor. It is noted that livability in the best 25% of the 74 flocks analyzed exceeds the Lohmann standard (Table 7). Mortality is only one of several important performance traits. Egg production rates and egg size were discussed in the first article in this series, feed consumption and conversion in the second article. The following fourth article (in this issue of Lohmann Information) will focus on the economic interpretation of these multiple factors.
References
Agra CEAS Consulting Ltd. (2004) Study on the socio-economic implications of the various systems to keep laying hens. Final Report for the European Commission.Anderson, K.E. (2011) First cycle report of the thirty-eighth North Carolina Layer Performance and Management Test, Vol. 38, No.3.
Bell, D.D. and T.M. Little (1966) Cage density as it relates to debeaking method. Proceedings of the 1966 Poultry Science Association annual meeting.
Bell, D.D., D.Kuney and C.J.Adams (1983) A study of cage shape, size and stocking density. Progress in Poultry #26. University of California.
Bell, D.D. (1985) Strain/season relationships for egg production, feed consumption, feed conversion, and mortality in commercial egg production flocks. Progress in Poultry #30, University of California.
Bell, D.D. (1993) Choosing the optimum temperature for table egg performance. Unpublished, University of California
Bell, D.D. (1993) Commercial flock performance – effect of season. Unpublished, University of California.
Bell, D.D. (1995) Forces that have helped shape the U.S. egg industry – the last 100 years. Poultry Tribune, pp. 30-43.
Bell, D.D. (1996). Can egg producers afford to not beak trim their flocks? Proceedings of the 45th Western Poultry Disease Conference.
Bell, D.D. (1999) Layer flock mortality study, non-molted vs. molted flocks – National data (1997-1998). Miscellaneous publication, University of California.
Bell, D.D. (2002) A summary of cage density studies conducted by the University of California Cooperative Extension – 1960 to 1994, Unpublished.
Bell, D.D. (2003) Mortality levels, patterns and effects on overall performance and economics. Egg Economics Update #255, University of California.
Bell, D.D. (2005) Contemporary flock performance record analyses – 2004-2005, Progress in Poultry #42, December.
Bell, D.D. (2009) Seasonal Flock Performance – housing date and month of data, Egg Economics Update #310. University of California.
Bell, D.D. (2009) Temperature – Various associated factors. Egg Economics Update #305. University of California.
Bell, D.D. (2011) The challenges of management for today’s high performing laying hens – Part 1: Egg production and egg size. Lohmann Information, 46 (2), pp. 8-15.
Bell, D.D. (2012) U.S. Experiences with Lohmann Selected Leghorn (LSL-Lite) Layers – Part 2: Feed Consumption and Conversion. Lohmann Information, 47 (1), pp. 14-20.
Sterling, K.G., D.D. Bell, G.M. Pesti and S.E. Aggrey (2003) Relationships among strain, performance and environmental temperature in commercial laying hens. Journal of Applied Poultry Research 12:85-91.
Zusammenfassung
Praxisergebnisse mit LSL LITE Legehennen in den USA, Teil 3: Verluste und VerlustursachenIm dritten Teil einer Serie von Untersuchungen zu Leistungsdifferenzen zwischen Praxisbetrieben geht es vorwiegend um Verlustraten und wichtige Einflussfaktoren, die einen Teil der Varianz erklären können. Anhand der Ergebnisse von 74 Herden einer einzigen Herkunft (LSL LITE) wird die Varianz zwischen Betrieben dokumentiert und interpretiert.
Verluste können bei allen Herkünften in unterschiedlicher Höhe auftreten und/oder im Laufe der Legeperiode steigen. Außergewöhnliche Verluste haben häufig Ursachen, die in wenigen Wochen abklingen. Z.B. können grobe Fehler in Futtermischungen erhöhte Verluste bringen, Feldinfektionen mit virulenten Erregern können zu Verlusten von 25 bis 50% und mehr in ungeschützten Herden führen, ganze Herde können Feuer oder extremen Temperaturen zum Opfer fallen. Betriebsvergleiche sind ein unverzichtbares Mittel für die Beratung und sollten genutzt werden, um das genetische Leistungspotenzial in der Praxis möglichst auszuschöpfen.
Assine nosso boletim informativo
And find out about all the latest industry news.