Abstract
Dogs and cats have traditionally been kept on farms and other households and were fed offal from human consumption. Dogs were used as guards or for hunting; cats had an important role to play in the control of rodents. In industrialized countries, dogs and cats are nowadays kept mainly as companion animals and fed on high quality commercially produced feed. As carnivorous animals by nature their diet contains high amounts of materials of animal origin which could be suitable for human consumption. This raises the question of the impact of dog and cat feed from animal origin on the use of scarce resources and the environment. It was the aim of the present study to estimate feed consumption, land use and carbon dioxide equivalents (CO₂e) for dogs and cats as the most frequent carnivorous companion animals in the USA, EU and selected European countries from available statistics. The total number of dogs and cats is similar in the USA and in the EU. However, the number of dogs and cats per capita is higher in the USA than in the EU and any selected European country. Annual feed intake was estimated 98 kg (23kg dry matter) per cat and 211 kg (76.5 kg dry matter) per dog. The fraction of materials of animal origin is 50 % for cats and 45 % for dogs. Land use for feed production was about 1000 m² per cat and 2000 m² per dog. Annual CO₂e for cats and dogs was 411 and 840 kg respectively. Arable land required for the production of feed for cats and dogs varied between 10 and 20 % of the national land resources. The CO₂e for dog and cat feed is about 1 – 2 % of the countries’ total CO₂e production, but equals about 10 % (for a cat) to 20% (for a dog) of the CO₂e for feeding their owner. The contribution of feed for dogs and cats on the overall production of greenhouse gases may be overestimated in the public discussion, but cannot be neglected if food consumption is considered.
Keywords
Genetics, Bone Deformity, Bone Fracture, Laying Hens, Keel BoneCo-Author
T. Vellinga and W. Bessei
Introduction
Keeping animals for meat production and meat consumption is being criticized for various reasons. Ethical concern is raised on the prevailing husbandry systems of intensive livestock production, transport of animals to the slaughter house and the large number of animals which are being killed for meat production. Another important point in the public discussion is the impact of livestock production on the environment. Emissions from intensive livestock farming are considered to deteriorate the environment through emission of ammonia, nitrate, phosphate and greenhouse gases, such as CO2, methane, and nitrous oxide. Manure from concentrated production units represents a risk of increased nitrate in the ground water and accumulation of phosphorous in the soil. Clearing the rain forest in tropical countries to satisfy the increasing demand for feedstuff, mainly soybeans, is a further negative environmental effect of intensive livestock production. In fact, livestock production and especially of ruminants has been estimated to contribute considerably to the worldwide production of greenhouse gases. Besides all livestock production is an important factor in land use for feed production. This is insofar difficult to justify because the meat consumption of the population in industrial countries exceeds the demand for protein and energy of the urban population. Furthermore overconsumption of meat is considered to represent a serious health hazard for humans. Associations of vegetarian or vegan nutrition recommend to completely stopping meat consumption.A reduction of meat consumption by 50% is suggested by Governmental authoritiesand by NGOs in Germany with the aim to reduce the emissions of greenhouse gases (BUND, 2018). On the worldwide level McMichael et al. (2007) recommend a per caput meat consumption in industrial countries to 90 g per day (33 kg/year). Considering the present consumption of 200 to 250 g per capita and day (73 – 91 kg/year) in industrial countries the use of meat should be reduced by about one third. Experts in human nutrition, in contrast, underline the importance of food of animal origin for humans as omnivorous beings (Biesalski et al., 2017).
In the debate on meat consumption of the human population the role of companion animals has received little attention. Indeed most statistics on per caput meat consumption include not only losses during processing and storage but also the use for feed of carnivorous companion animals, mainly dogs and cats. It is generally assumed that dog and cat feed is based on slaughter offal which is not suited for human consumption. There is, however, not sufficient slaughter offal to satisfy the demand for commercial dog and cat feed. Hence parts of slaughtered animals with low preference by human consumers, such as tripe, liver, kidney, fat, etc. are used. Some of these components, such as liver, contain important amounts of essential amino acids, micro-nutrients and essential fatty acids. Others are even culinary specialties in Europe and overseas. Chicken and duck feet for example, which are not considered as edible product in European countries are highly appreciated in Asian countries and imported in large quantities. To some extent Europe imports meat from game animals, such as springbok from Africa and kangaroo from Australia to be used as pet food. There is increasing interest to quantify the share these companion animals take in meat consumption and related environmental criteria. Thepresent study aims at calculating the impact of food for carnivorous companion animals, such as dogs and cats.
Number of dogs and cats in relation to the human population
The number of dogs and cats is almost the same in the USA and in the EU (Table 1). However, there is a higher number of dogs and cats per capita in the USA than in Europe (216 and 229 dogs and cats per 1000 persons for the USA and 134 and 146 for the EU). There is a wide variation between the European countries. With regards to the number of cats per 1000 inhabitants in the selected countries France shows the highest (177) and Spain the lowest (74) density. For dogs the highest number per 1000 inhabitants exists in Poland (192) and the lowest in Germany (65).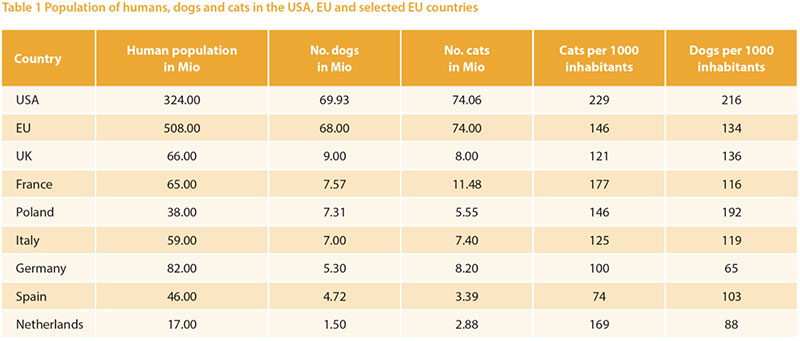
Food of animal origin and related environmental criteria
Dogs and cats which are kept in households of industrialized countries are mainly fed specialized commercial food of animal and plant origin. The ratio of animal derived components is higher for cats than for dogs. Dogs are able to utilize plant components more efficiently than cats. Quantified ingredient lists for dog and cat feed are not available, but the declaration on packed dog and cat feed gives some information. Results of a study on the nutrient composition of dog and cat feed are shown in Tables 2 and 3.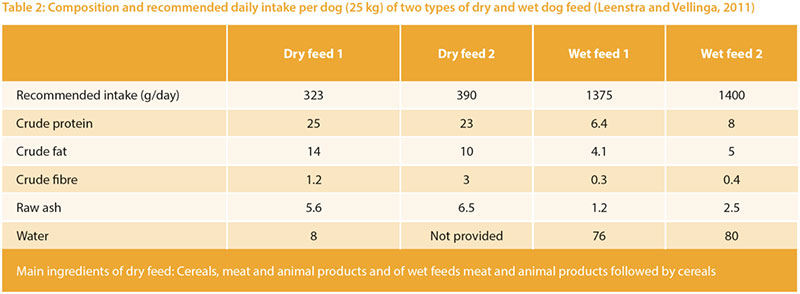
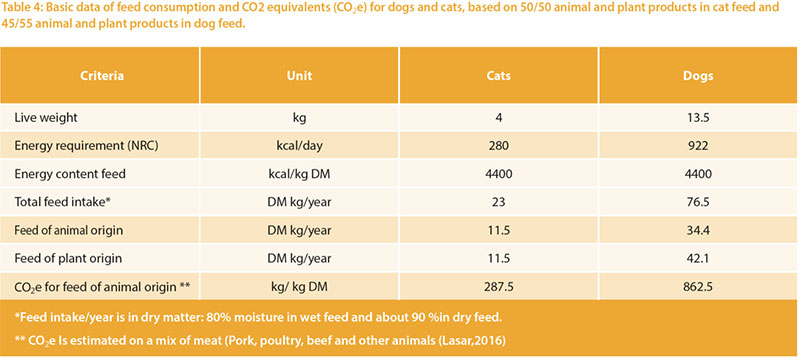
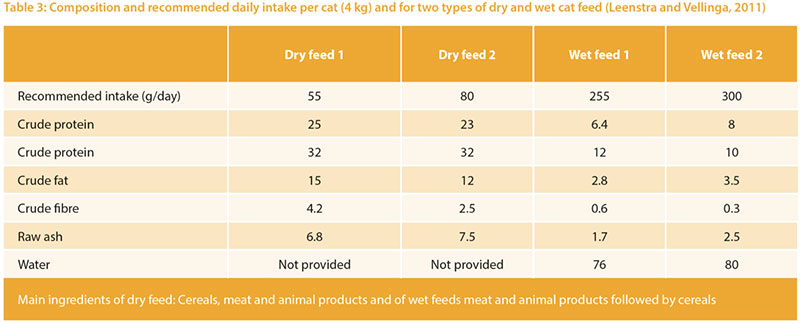 Crude protein content of dry dog feed (> 90 % dry matter) varies between 23 to 25 % and wet feed (about 20 % dry matter) between 6.4 to 8 %. Cat feed is higher in crude protein: 32 % in dry feed and 10 – 12 % in wet feed. This is within the span of the NRC recommendations for dog and cat feed. The diets contain a large variety of raw materials. The percentages of the individual ingredients are, however, not declared. Hence it is not possible to exactly determine the share of animal and plant based feedstuff. In the USA the fraction of energy in dog and cat feed derived from animal products varies between 24 and 47 %, with minor difference between dog and cat feed (Okin, 2017). We assume that the fraction of animal derived materials in cats feed is 50 % and in dog feed 45 % (Leenstra and Vellinga, 2011). The basic data and the estimate of feed intake, land use and carbon dioxide equivalents derived from feed of plant and animal sources is shown in Table 4. Taking feed from both animal and plant origin a medium sized dog (13.5 kg) consumes 76.5 kg dry matter annually (about 82 kg if only dry feed would be given and 383 kg for only wet feed) and a cat of 4 kg mean weight consumes 23 kg dry matter annually (about 25 kg if only dry feed would be given and 115 kg for only wet feed). With regard to the high variation of raw materials of plant and animal origin used in pet food it is not possible to get an exact calculation of land use and CO2 equivalents (CO2e). Land use given in Table 4 is based on LCA studies of Williams et al. (2006). The annual land requirement for one cat is estimated at1000 m² and for a dog at 2000 m². The plant fraction in the diets represents less than 10 % of total land use. These figures are based on high crop yields from North-West European conditions. More land may be required under less favorable climatic and soil conditions. Since the animal derived components of dog and cat food is based on animal products which might be suitable for human consumption, we used data from human diets. According to Lasar (2018) a mix of animal derived products results in 5.49 kg of CO₂e per kg product. The CO₂e per kg of the vegetarian diets is by the factor 1.5 to 2.0 lower than animal based diets (Reijnders and Soret, 2003). Table 4 shows that the CO₂e emission per kg dry matter of dog feed is 863 and that of cat feed is 288 kg CO₂e per year.
Annual feed consumption in selected countries
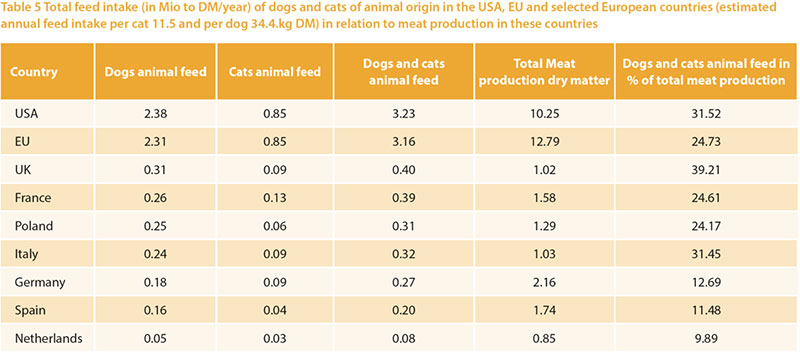
TDog and cat food contains relatively high fractions of components from animal origin. Therefore the fraction of dog and cat food of animal origin is shown in relation to the total meat production by country in Table 5. Since water contents differ widely in dry and wet feed, all data are calculated on dry matter (DM) basis, assuming a mean dry matter level of 25 % for meat derived products. Dogs and cats consume about the same amount of animal feed in the USA and in the EU (3.23 and 3.16 Mio to DM/year respectively for the sum of dog and cat food). The proportion of dog and cat food of total meat production is highest in the UK followed by the USA and Italy. Germany, Spain and The Netherlands show the lowest proportion ranging from about 10 to 12 % and France and Poland take an intermediate position of about 24 %. The high proportion of dog and cat food in the UK and Italy is obviously due to the relatively low national meat production (1.02 and 1.03 Mio to). The high level of feed of animal origin for dogs and cats from our calculation may seems surprising. However, other authors report similar results. According to Weiler (2016) the consumption of meat products of dogs and cats in Germany was 1.43 Mio to fresh weight. This corresponds to 0.358 Mio to dry matter, which is higher than our estimate (0.27 Mio to). The difference is obviously based on a higher number of dogs and cats assumed in Weiler´s calculation. For The Netherlands, Luske and Blonk (2009) estimated that half of the category3 animal products (e.g. products which are suitable for human consumption) are used in pet food. Leenstra and Vellinga (2011) estimated that total feed energy requirement of one human equals the requirement of 3 dogs and 10 cats, which is 33 and 10 % respectively. Since many dogs and cats are overfed, data on feed consumption may be underestimated.There is a rapid increase of meat consumption in countries which are on the way of industrialization (Windhorst, 2011) and it is expected that more pet animals will be kept. This will lead to an increase of the use of animal products for pet animals worldwide.
Land use
The use of arable land for pet food isbased on calculations of Williams et al. (2006). The authors differentiate between “fish and meat” and “byproducts”. Since animal based ingredients for pet food compete with human consumption (as explained before) the values of “fish and meat” have been used by Leenstra and Vellinga (2011) and for the present study. The higher average land use for dogs (about 2000 m2) as compared to cats (1000 m2) reflects the higher feed intake of dogs compared to cats. 24.1 Million ha of arable land are required both in the USA and in Europe to produce feed for both species of companion animals (Table 6). This represents 13.4 % (USA) and 19.8 % (EU) of total arable land. The share of land use for dog and cat feed varies widely among European countries with the highest values in the UK, Netherlands and Italy (42.6; 33.3 and 30.4). But even in the lower land use category more than 10 % of arable land is required to produce food for pet animals. Williams et al. (2006) reported an average land requirement of 12500 m² per head and year for food of humans. Hence cats use 8 and dogs 18 % of the land requirement of humans for food production. Vale and Vale (2009) reported considerably higher values for land use of dogs and cats (11000 and 1500 m² respectively). The higher land use estimates may be due to the assumption of feed production under less favorable soil quality and climatic conditions. The authors also not only consider space required for feed production but also for other inputs.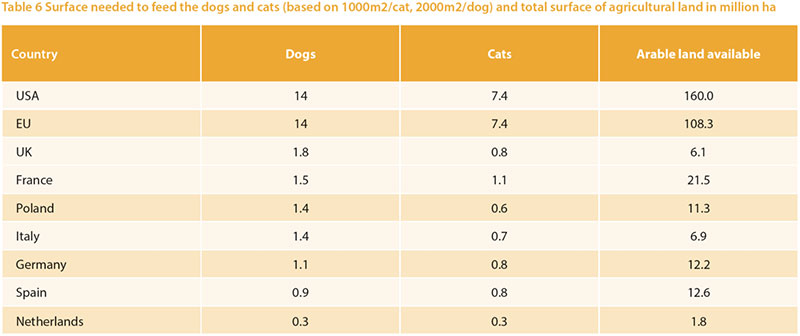
Green house gases
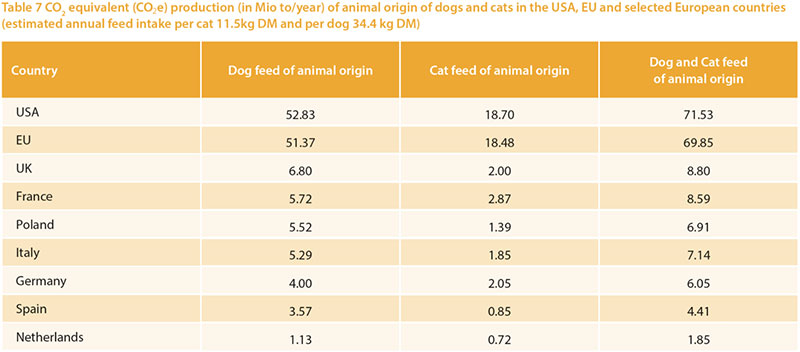
Feed production is the main component of production and emission of greenhouse gases in animal production. Therefore, the present study focusses on the effect of dog and cat food of animal origin on emission of CO₂e. There is no reliable statistical information on the quantity and only vague reports on the type of raw materials used in dog and cat food. The producers claim that all ingredients stem from sources which are suitable for human consumption, in particularly those of animal origin. Hence we used the estimate of a mix of different meat products (pork, poultry, beef and others) for the calculation of CO₂e (Lasar, 2017). According to this information the CO₂e is 5.49 kg per kg of fresh meat. Considering an average dry matter content of 25 % for meat the correspondent value is 21.72 kg CO₂e per kg dry matter. The CO₂e emissions per country from the animal part in dog and cat food are shown in Table 7. The CO₂e values follow directly the amount of food consumed by dogs and cats. Here again the figures for the USA and EU are similar (52.83 and 51.37 Mio. to annually for dogs; 18.70 and 18.85 Mio to for cats). The estimatesfor the USA are lower than those of Okin (2017), who reported CO₂e for the feed of dogs and cats of animal origin of 64 Mio to annually. Since the Standard Deviation was high (+16 Mio to) our estimate is still within the range of Okin`s result. The higher CO₂e emissions in Okin (2016) may also be due to the fact that a higher weight for dogs was used (22 kg vs. 12.5 kg in our study). Considering total CO₂e emissions in the USA and the EU of 6870 and 3527Mio annually the CO₂e for feed of dogs and cats of (71.53 Mio to in the USA and 69.85 Mio to in the EU) represent 1.9 and 1.0 % of total CO₂e emissions respectively. The ratios of CO₂e to total CO₂e production in the other countries are in a similar range. However, if only CO₂e from food is considered, cats and dogs require a higher proportion: about 2-5%.Restricting the number of companion animals, keeping smaller dogs and feeding cats and dogs vegetarian diets, as recommended by Okin (2007) and Vale and Vale (2009), will not have a significant impact on global environmental problems, although current environmental impact of dogs and cats is of a similar magnitude as Meatless Monday or Veggy Day for the human population.

Conclusion
Meat consumption by humans has been discussed extensively with regard to its negative effect on the use of natural resources and emission of greenhouse gases. Recent publicity has called attention to the fact that dogs and cats compete forhuman food of animal origin and land use. Emissions of greenhouse gases of these animals have been considered as a serious cause of global warming. The present study shows that dogs and cats indeed use a considerable percentage of animal derived products which could be used in human nutrition and land required for the production of dog and cat food represents 10 to 20 % of arable land in the USA and EU countries.However, relative to the total emission of greenhouse gases (CO₂e) the fraction which can be attributed to dog and cat food is low.. The impact of dogs and cats on the environment as discussed by Vale and Vale (2009) and Okin (2017) seems to be overestimated. Reduction of the number of dogs and cats, or keeping smaller animals on vegetarian diets will not contribute significantly to the reduction of global environmental emission problems.
References
Biesalski, K. (2016) Meat as a healthy and valuable source of micronutrients. Lohmann Information 50(2): 4–11.
BUND, Friends of the Earth Germany (2018) Fleischatlas 2018. https://www.bund.net/ service/publikationen/detail/publication/ fleischatlas-2018/, zuletzt aktualisiert 2018. Lasar, A. (2018) CO2- Fußabdruck richtig berechnet – Weniger Fleisch – mehr Klimaschutz? DGS INTERN 2018 (6), 3.
Leenstra, F. and T. Vellinga (2011) Indication of the ecological foot print of companion animals First survey, focussed on cats, dogs and horses in The Netherland. Wageningen UR Livestock Research en Central Veterinary Institute. Wageningen (Rapport 509, ISSN 1570 – 8616). https://www.wur. nl/nl/Expertises-Dienstverlening/Onderzoeksinstituten/ Livestock-Research.htm.
Luske, B., and H. Blonk (2009) Milieueffecten van dierlijke bijproducten. www.blonkmilieuadvies.nl.
NRC (2006): Nutrient requirements of cats and dogs. National Academy Press, Washington.
Okin, G.S. (2017) Environmental impacts of food consumption by dogs and cats. In: PloS one 12 (8), e0181301. DOI: 10.1371/ journal.pone.0181301.
Reijnders, L. and S. Soret (2003) Quantification of the environmental impact of different dietary protein choices. In: The American Journal of Clinical Nutrition 78 (3), 664S-668S. DOI: 10.1093/ajcn/78.3.664S.
MEG (2017) MEG Marktbilanz Eier und Geflügel 2017. Verlag Eugen Ulmer, Stuttgart, Germany.
Vale, B. and R.J.D. Vale (2009) Time to eat the dog. The real guide to sustainable living. Thames & Hudson. London, U.K.
Weiler, Ulrike (2016): Fleisch essen? Eine Aufklärung: Verlag Westend, Frankfurt/ Main, Germany.
Williams, A.G., E. Audsley and D.L. Sandars (2006) Determining the environmental burdens and resource use in the production of agricultural and horticultural commodities. Cranfield University and Defra. Bedford, UK (Main Report. Defra Research Project IS0205). www.silsoe.cranfield.ac.uk, and www.defra.gov.uk.
