


Summary
Domestic male rabbits kept in groups tend to develop bite injuries toward the end of the fattening
period due to bucks being attacked by other bucks. The frequency of aggressive behaviour and age
at onset of biting among genetic groups was measured. A total of 193 pairs of bucks, 142 of known
parental origin from 5 different genetic groups, were kept under similar conditions. The experimental
unit consisted of two male litter mates kept in conventional fattening cages.
To stop bite injuries and attacks, 43 % of all pairs had to be separated. The difference among genetic groups was not statistically significant and seems to be of minor importance for commercial fattening of rabbits. Genetic groups differed significantly in average age when the aggressive behaviour was observed, however, this difference seems to be of no more practical interest than the differences in age at which the first pairs had to be separated.
There was no statistically significant difference in body weight between the aggressor and the recipient among genetic groups at housing and at separation. There was no correlation between the frequency of mounting and the probability of separating cage mates because of aggressive assaults. The genetic groups, however, differed in age at the beginning of the mounting. Chasing increased significantly with age. This behaviour was seldom observed during the first weeks, suggesting that this behaviour, like mounting, is associated with sexual maturation. Chasing behaviour, however, was too infrequent and irregular to be used as a correlated trait to prevent bite injuries.
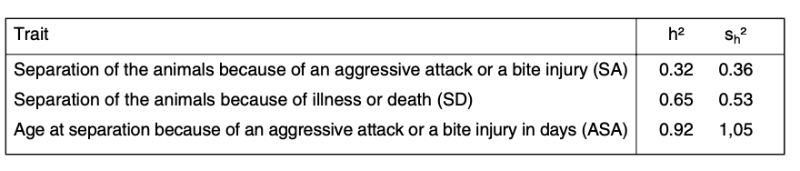
Pooled heritability estimates for the 5 genetic groups were h² = 0.32 for the frequency of injuries and h² = 0.92 for the age at which the injuries occurred. If these estimates are confirmed within specific lines, they would indicate good possibilities to reduce the frequency of attacks and bite injuries through targeted selection.
To stop bite injuries and attacks, 43 % of all pairs had to be separated. The difference among genetic groups was not statistically significant and seems to be of minor importance for commercial fattening of rabbits. Genetic groups differed significantly in average age when the aggressive behaviour was observed, however, this difference seems to be of no more practical interest than the differences in age at which the first pairs had to be separated.
There was no statistically significant difference in body weight between the aggressor and the recipient among genetic groups at housing and at separation. There was no correlation between the frequency of mounting and the probability of separating cage mates because of aggressive assaults. The genetic groups, however, differed in age at the beginning of the mounting. Chasing increased significantly with age. This behaviour was seldom observed during the first weeks, suggesting that this behaviour, like mounting, is associated with sexual maturation. Chasing behaviour, however, was too infrequent and irregular to be used as a correlated trait to prevent bite injuries.
Pooled heritability estimates for the 5 genetic groups were h² = 0.32 for the frequency of injuries and h² = 0.92 for the age at which the injuries occurred. If these estimates are confirmed within specific lines, they would indicate good possibilities to reduce the frequency of attacks and bite injuries through targeted selection.
Introduction
Domestic rabbits are usually fattened in groups, which may occasionally lead to bite injuries toward the end of the fattening period. The reason for this are bucks attacking pen or cage mates. As early as 1917, Starke recommended for rabbit husbandry: “The bucks should be kept together as long as they get along peacefully, but they have to be separated at the age of 4 months.” Injuries to males are mostly around the testicles. Reasons to minimize these injuries include animal welfare as well as economical considerations because some of the injured animals die or have to be killed. Moreover, the meat of injured animals is not useable for human consumption, because their carcasses are rejected by the official meat inspection.Aggressive behaviour among rabbits may cause problems in backyard keeping for private use (Koetter and Werner, 1985) as well as in commercial production, especially when kept in larger groups as recommended by animal welfare (Bigler and Oester, 1994). It is unknown to what extent differences among and within genetic groups affect the age at which aggressive behaviours start and the frequency at which they occur. Should genetic differences in these traits exist among lines, the fattening period could be optimised in order to minimise bite injuries. In case there are substantial genetic differences among families within lines, it should be determined to what extent this problem could be reduced by selection.
Parts of the submitted investigations have been presented as lectures at two conferences (Heil, 1997 and Heil, 2003) and in a short article by Heil and Dempfle (2008).
Animals and animal management
The bucks studied originated from 5 genetic groups, 3 commercial crosses and 2 pure-lines of the breeds Californian and New Zealand White. Both pure breeds came from the Bavarian Institute for Animal Production in Kitzingen, where they are kept as closed populations. From each of these genetic groups 3 random samples were taken in their respective breeding station. The pedigree structure is shown in Table 1.Table 1: Origin of genetic groups
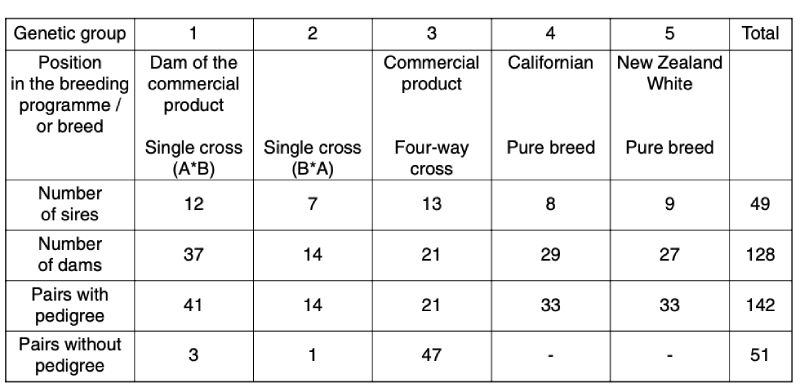
Most of the pairs were full sibs. In 2 of the 3 random samples of genetic group 3, all mothers were inseminated with mixed semen from 10 bucks. Therefore the sires in these pairs of animals are unknown.
The experiment consisted of 9 test periods. Animals of the same test run were caged in the same compartment of the stable. They differed in age by a maximum of 3 days, originated from 1 breeding station and belonged to 1 or 2 of the genetic groups. If both compartments were occupied at the same time, it was treated as 2 separate test runs.
The bucks were kept in galvanized wire cages (40 cm wide, 60 cm long and 25 cm high), which were laid out in a flat deck arrangement. In each cage there was a feed dispenser for manual refilling at the front and 2 nipple water dispensers at the rear. Two compartments of a stable with 24 cages each were available for the tests. Compartments were separated by a solid wall and were aired independently. Pelleted whole feed for rabbit breeding and fattening was provided with the composition as declared by the manufacturers is shown in Table 2.
Table 2: Feed composition according to manufacturer’s declaration
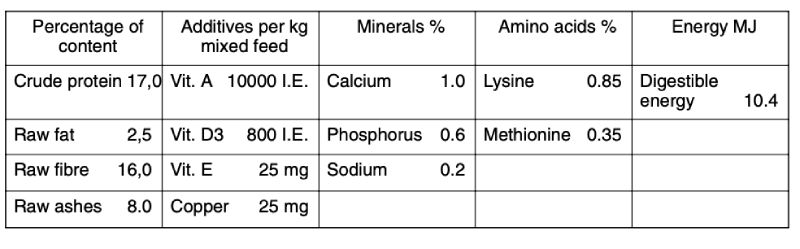
In the first test run the daily allotment of the feed was only as much as could be consumed in the morning. This was intended to evoke more biting during feeding to facilitate observation and control of its development. In this test run no biting was observed during and after feeding. Therefore, starting with the second test run, feed was provided ad libitum. Water was offered ad libitum via the nipple drinkers.
In the windowless stables a daily light cycle of 12 hours darkness and 12 hours light was kept. In the first 7 test runs the light cycle started and ended within one-hour of dusk or dawn. Starting with the 8th test run, the dusk or dawn period was reduced to 15 minutes in order to observe further features of behaviour. The light intensity at animal level was kept at 3.5 lux during dusk or dawn and 48 lux during the remaining light cycle.
The temperature of the heated stables was between 15° and 25° C depending on the season. The relative humidity of the air ranged between 60 and 70 %.
Data Collection
The data were collected between May 1993 and March 1996. The experimental unit consisted of 2 bucks in 1 fattening cage. In order to simulate commercial practice, 2 males and 2 females from the same litter were caged together in the first test run. At 18 weeks of age – before any biting was observed – the does were removed from the cages, because some of them were already pregnant. To avoid having to slaughter pregnant does, only 2 male litter mates were caged together for the second and subsequent test runs. The age at housing was between 6 and 12 weeks, depending on the breeding station of their origin. In 7 test runs the observations ended at the age of 31 weeks whereas in the 1st run the observations had to be stopped in week 27 due to an outbreak of a Pasteurella disease and in the 4th run the observations were stopped in week 28 as only 2 out of 24 cages were still occupied.All animals were weighed at the beginning of a test run, at 8 to 13 weeks of age. Pairs of bucks were separated when the caretakers observed attacks or bite injuries during their usual cleaning rounds and observation patrols. Age on the day of separation and the weight of the animals with injuries (victim) and without injury (aggressor) were recorded. It was never observed that both animals had been injured.
In the first few test runs, attacks and bite injuries were less frequently than expected. Therefore the correlation between sexual activity and aggression was more closely examined from the 6th run on. Additional observations were made with 72 pairs of genetic groups 3, 4 and 5.
Sexual activity was indirectly measured by the trait “mounting with mating movements” to the homosexual partner. The bucks were observed in the mornings within the first hour after dusk through mirrored glass panes. This timing seemed particularly opportune as the animals, which are generally active at dusk or dawn are intensely active during this short interval around the shift of lighting. The phase of activity before the end of the lighting phase could not be observed for technical reasons.
Along both far ends of the two adjoining compartments there were 2 mirrored windows for each compartment, there being 4 windows per compartment in all. Through one window the animals in 6 of the 24 cages of one compartment could be observed from the hall side, so that all animals could be observed through the 4 windows of a compartment. The animals in 6 cages were observed together for 5 minutes each and recorded whether “mounting with mating movements” had occurred. The observations started at 9 weeks of age and were conducted 5 times each week by 2 persons, with few exceptions. Both observers watched different cage groupings simultaneously from the two opposite sides of the hall. After all cages on a side of the hall were observed, the observers changed to the other hall side.
At any day on which observation was taken we obtained information for all cages, taken during 2 periods of 5 minutes by 2 different people. For each observation period the observers were randomly assigned to which hall sides to start and to the order of the cage groupings to be observed. While observing behaviours during the 6th and 7th run, we became aware of the following activities: the bucks in a cage were chasing each other in circles around the cage for 5 to 10 seconds, which appeared as if one animal was driving the other in front of it. This behaviour was observed in very irregular periods and will be called “chasing”. In order to investigate whether chasing occurred more often and therefore may signal an upcoming biting, it was recorded in the 8th and 9th run in addition to mounting behaviour.
Definition of Observed Traits
For all pairs the following traits were recorded:SA Separation of the animals due to attacks and bite injuries (aggression): no = 0; yes = 1.
SD Separation of the animals because of disease or death: no = 0; yes = 1.
For pairs separated because of attacks and bite injuries:
ASA Age at separation because of attacks and bite injuries in days.
WDC Weight difference between the aggressor and the victim at the beginning of a test run („caging“), at 8 to 13 weeks of age.
WDS Weight difference between the aggressor and the victim at the time of separation.
Additional traits in runs 6 and 9 for genetic groups 3, 4 and 5:
NM Average number of 5-minute observation periods per week when mounting was observed (except for rare occasions, 10 observation periods per week).
Additional trait in runs 8 and 9 with genetic groups 3, 4 and 5:
NC Average number of 5-minute observation periods per week when chasing was observed.
NCS Average number of 5-minute observation periods per day when chasing was observed (calculated for the last 6 days for pairs separated because of aggressive attacks).
Biometric evaluation
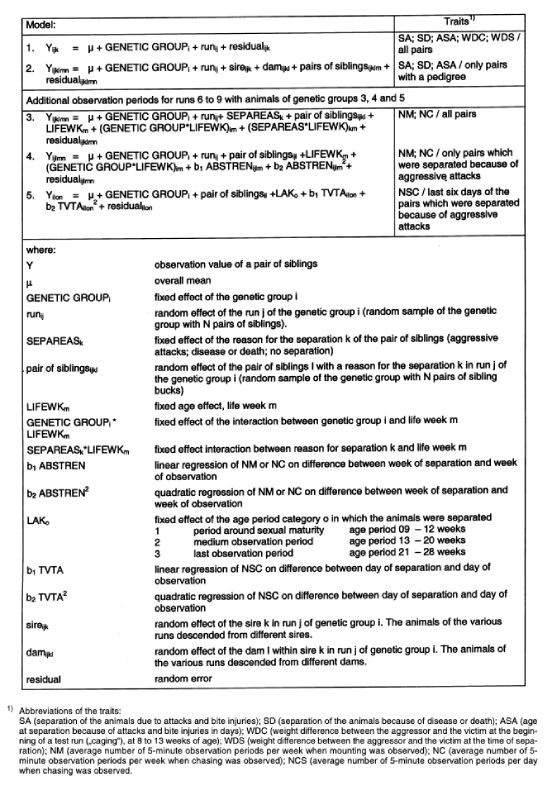
Out of all pairs of bucks, 43 % were separated because of aggressive behaviour, 22 % due to illness or death. With these frequencies of a binominal distribution, the theoretical assumptions for the analysis of variance are approximately fulfilled, and a transformation of the variables was considered as unnecessary. The models used are listed in Table 3.Estimation of fixed effects (models 1, 3, 4 and 5)
With model 1 the differences between the genetic groups were estimated for the traits SA, SD, ASA, WDC and WDS.
Model 3 was used to estimate systematic effects for traits NM and NC. Animals of a genetic group expressing trait NC (chasing) were only observed within one run. Therefore the random effect for runs within the genetic groups is omitted. The interaction between the genetic groups and the reasons for the separation of the pairs was not taken into account in model 2, because the interaction was not statistically significant (error probability p < 0.42 for NM and p < 0.65 for NS) and not all reasons for separation had occurred in all genetic groups. Model 4 was used to investigate whether pairs which were separated because of aggressive attacks showed increased frequencies of NM and NC before separation.
During the last few weeks before separation NC was observed more frequently than earlier. Therefore, starting with model 5, it was investigated whether NCS changed within the last 6 days before separation. First, the ages of the animals during the last few weeks before separation (LIFEWK) were included in the model as a fixed effect. This effect was statistically significant. However, from the differences between weeks of age no tendency could be derived. Therefore 3 biologically defined age classes of various lengths were defined instead of age in weeks and were used in model 4. The different lengths of age classes were expected to reveal whether the pairs behaved differently concerning the feature NCS around sexual maturity compared to the 2 periods after sexual maturity.
Estimation of random effects for the traits SA, SD and ASA (model 2)
With model 2, additive genetic variance was estimated for the traits SA, SD and ASA within the genetic groups. For this analysis data from all pairs with known dam were used. As there was only one cage per parents within the genetic group and run available for ASA, the residual variance could not be estimated.
Statistical Methods and Interpretation of Results
Statistical calculations were performed according to the Restricted Maximum Likelihood Method (REML) with the Procedure MIXED (SAS Institute Inc. 1999) and the program „The SAS System for Windows“ Release 8.1. The significance of fixed effects was statistically checked with the F-test and the Null-hypothesis rejected if the probability of a type I error was below α = 0.05.
Estimation of heritability
The sire component of variance ( sire) in model 2 estimates ¼ of the additive-genetic variance ( A) and is largely free of environmental, dominance and epistatic effects. It is particularly apt to estimate the heritability in the narrow sense (formulae 1). The average heritability was estimated across all genetic groups. To estimate the heritability for each genetic group would have required a larger number of sires per genetic group.
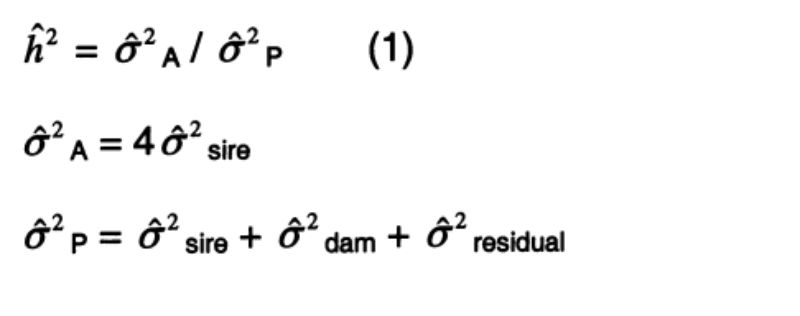
Table 3: Models used for statistical analysis.
The variance of heritability was calculated with the following formula, derived by means of a Taylor series:
Assumptions for the prediction of selection response for the trait SA
Based on parameters estimated in the current statistical analysis, the following conditions for a breeding programme were assumed available.
1. Aggressive behaviour is checked as described in this test series. For the setup, a stable with 100 cages is available.
2. The trait SA is divided into 2 categories: „separation because of aggressive attacks“ and „no separation because of aggressive attacks”.
3. It is desired that pairs do not have to be separated.
4. Half of the pairs have to be separated in the base generation (p=0.5).
5. SA has a heritability of 0.3. The heritability is not changed through selection.
6. The phenotypic variance of SA changes with the selection success and equals the variance of the binomial distribution. Vp = p(1-p). p = fraction of the pairs separated because of aggression
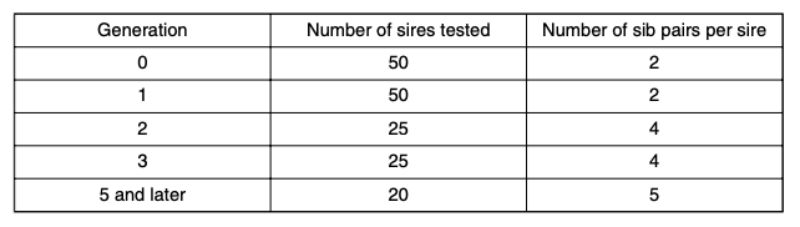
7. The fraction of pairs (p) which do not have to be separated, increases as a result of selection. In order to be able to continue selecting in spite of this fact, the number of pairs checked per sire is increased in generations 2 and 5. As a consequence, fewer sires can be used due to a constant testing capacity and selection intensities and accuracy of the estimated breeding values change. The number of sires used per generation and pairs of siblings from different dams are shown in table 4. A minimum of 20 sires per generation were tested.
Table 4: Number of sires and pairs of full sibs per sire tested per generation.
8. For the next generation all sires were selected whose offspring did not show any aggression, if possible.
9. As only the sires of the next generation were selected, the selection response was calculated with the following formula:
SR = ½ (i σA rIG)
Definitions:
i Selection intensity (standardized selection difference).
σA additive-genetic standard deviation
rIG accuracy of estimating the breeding value (correlation between the source of information and the overall breeding value)
Results and Discussion
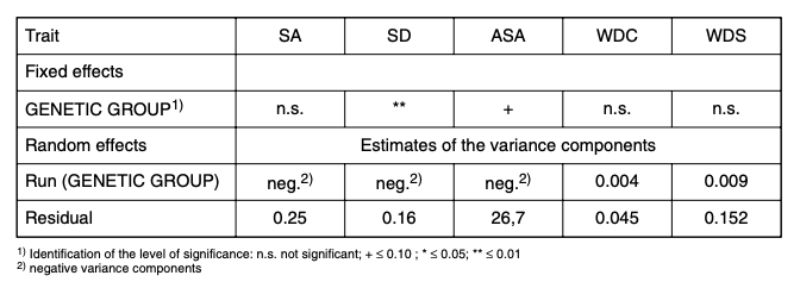
Traits: separation because of aggression (SA), separation because of disease (SD); age at separation because of aggression (ASA); weight differences at caging (WDC) and weight differences at separation (WDS) (Model 1) OverviewTable 5 shows the results of the statistical analysis based on model 1. The difference between these traits within the individual observation runs with the various genetic groups was of minor importance whereas statistically significant effects for the traits SA and ASA were found among the genetic groups. The genetic differences will be discussed in detail below because of their fundamental importance for all 5 traits.
Table 5: Results of statistical analyses based on model 1: fixed effects and variance
components for the random effects of the traits: SA (separation because of
aggressive attacks and bite injuries); SD (separation of the animals because of
disease or death); ASA (age at separation because of attacks and bite injuries in
days); WDC (weight difference between the aggressor and the victim at the beginning
of a test run („caging“), at 8 to 13 weeks of age); WDS (weight difference between
the aggressor and the victim at the time of separation).
Traits: separation because of aggression (SA) and separation because of disease (SD)
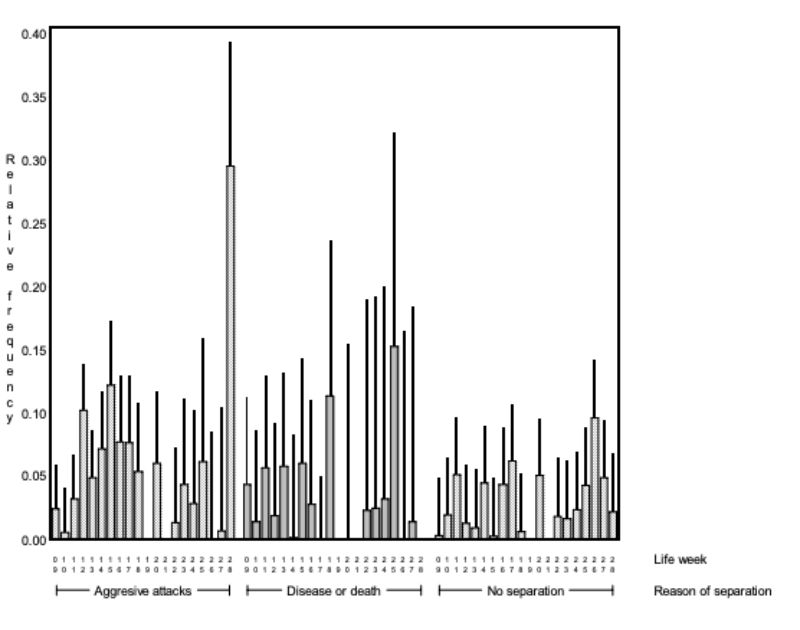
Within the genetic groups between 36 % and 53 % of the pairs had to be separated because of bite injuries or biting (SA, Figure 1). Differences between genetic groups were not significant (α < 0.73).
For all genetic groups a high potential of aggression was observed, which resulted in a considerable number of aggressive attacks. Although they did not start in all cases directly after the beginning of sexual maturity, they eventually did start in all genetic groups and often only noticed as bite injuries. With the trait SD there were differences among genetic groups (α = 0.01; Figure 1). Pasteurella infections, manifested mostly in form of festering, were the most common cause of loss. Some of this festering may have resulted from unnoticed bite injuries. In this way they could be an indirect consequence of an attack. Should this be the case in the majority of illnesses, SA and SD should be correlated. The average values of the traits SA and SD among genetic groups did not support this hypothesis. Especially in genetic group 2 there was the highest number of SA and no pair with SD, whereas in genetic group 3 there was the highest frequency of SD-pairs (38 %) and a high frequency of SA-pairs (44 %).
Almost 40 % “losses” suggest that these hybrids, which are designed to be slaughtered before sexual maturity, should not be kept in groups longer than sexual maturity is reached.
Figure 1: Relative frequency (average values and 0.95
confidence limits) at which
the animals of the genetic
groups were separated in
the course of the tests
because of SA (separation
because of aggressive
attacks and bite injuries)
or SD (separation because
of illness or death). (BLUE
– estimates from model 1)
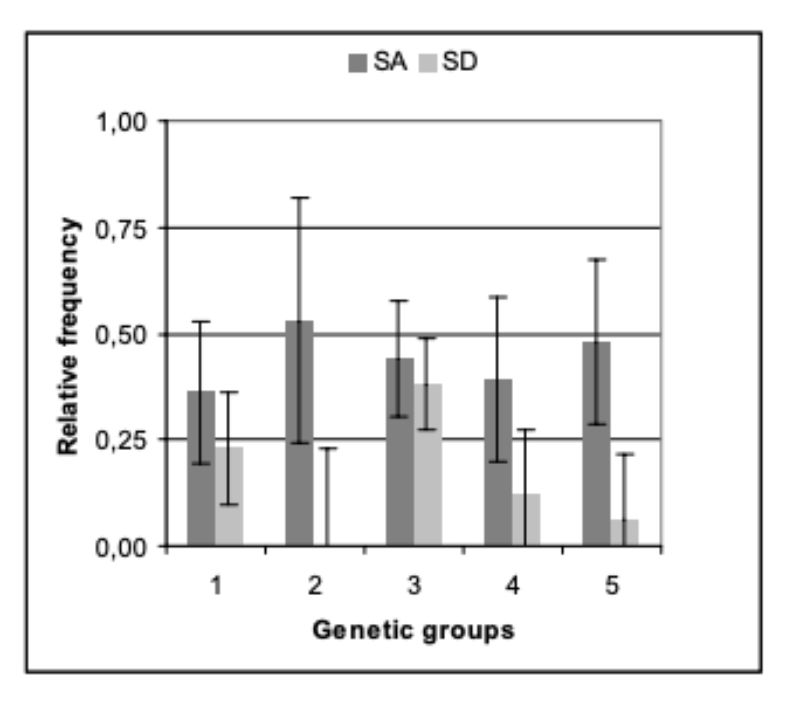
For trait SD, differences between genetic groups are statistically significant (α < 0.05). Trait: age at separation because of aggression (ASA)
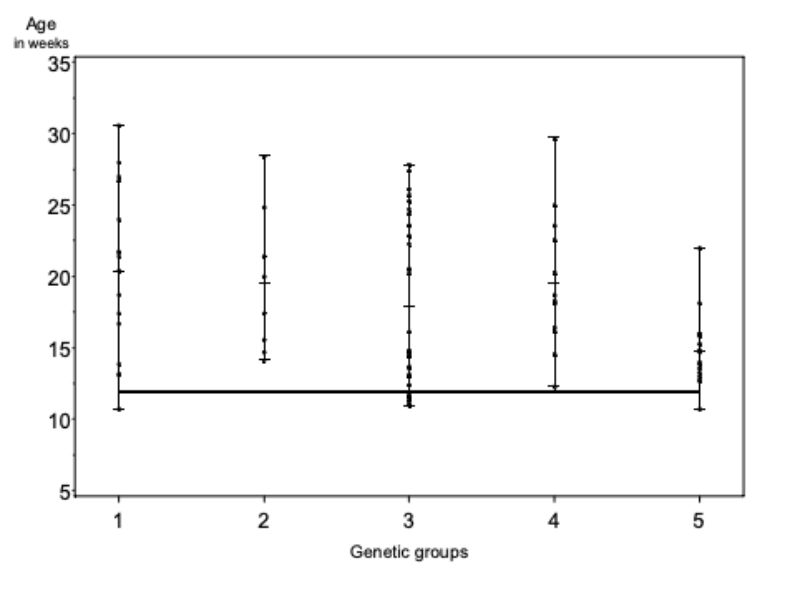
The genetic groups differed slightly in their average age at which the pairs had to be separated because of aggressive attacks and bite injuries. The average age for genetic groups 1 – 5 were 20.3, 10.6, 17.9, 19.5 and 14.0 weeks (α ≤ 0.09; BLUE – estimation from model 1). But these differences do not seem to be of practical significance for rabbit fattening. As illustrated in figure 2, pairs from all genetic groups had to be separated during the observation period to stop biting.
The age at which the first pairs had to be separated, seems to be of particular importance for the fattening of rabbits. With respect to this trait, the differences among genetic groups were also of minor importance. In 3 groups the first separation because of aggressive attacks became necessary at the end of week 11, in the other 2 groups at the beginning of weeks 13 and 14.
Figure 2: Age of the genetic groups at the separation because of aggressive attacks (ASA).
Age of 12 weeks is indicated by a solid line. Around this age the animals were
generally sexually mature. Among the genetic groups there is some indication of
differences (α < 0.09).
Traits: weight differences at caging (WDC) and weight differences at separation (WDS)
As shown in Figure 3, the attacking rabbits were not substantially heavier than the victims when caged (WDC) nor when separated (WDS). Differences among genetic groups were not significant for these traits (α = 0.34), but the data indicate that aggressive attacks were more frequent if the weight difference exceeded + 0.5 kg near the end of the fattening period. This observation is confirmed by those of Koetter and Werner (1985) who reported that when rabbits are fattened in groups and aggressive attacks take place, the heavier bucks almost always attack other members of the group.
Figure 3: Weight difference between attacker and victim at the time of „caging“ (WDC) and
at the time of separation (WDS)
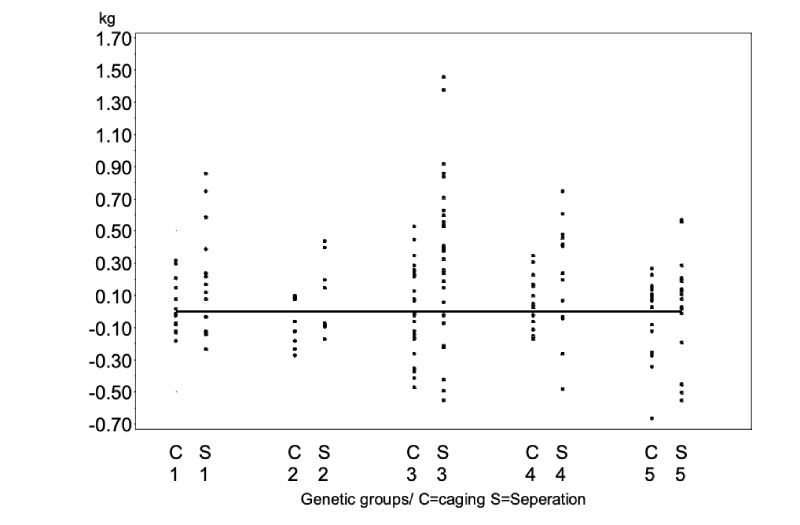
The overall average of the differences (WDC = 0.000 kg; WDS= 0.044 kg) are not statistically significant (α=0.70). Differences among the genetic groups are different (α=0.34).
Models 3, 4 and 5
Overview In Table 6 the results of the statistical analyses are shown for traits NM and NC, based on model 3. For NM, the interaction between genetic group (GENETIC GROUP) and age (LIFEWK) was statistically significant and these two effects are described in detail below. For NC, neither the differences between the genetic groups nor their interaction were significant. The detailed presentation for this trait only describes the influence of age (LIFEWK) and its interaction with the reason for separating (REASSEP) the pair of cage mates.Table 6: Results of the statistical tests1) about the fixed effects and the estimated values of
the variance components of the random effects of model 3. Traits: NM (Average
number of 5-minute observation periods per week when mounting was observed);
NC (Average number of 5-minute observation periods per week when chasing was
observed)
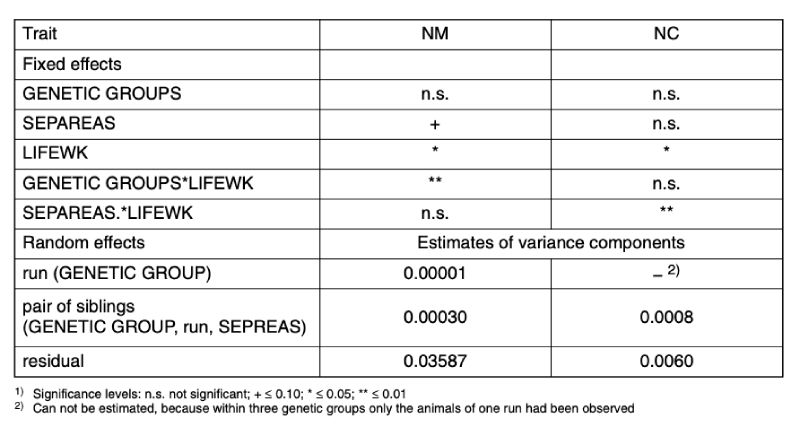
As far as random effects are concerned, the residual variance, i.e. variation between repeated observations of the same pair in different weeks of age, was substantially greater than that between pairs within genetic group, run and reason for separation. Even the random differences between runs within a genetic group were of minor importance for trait NM. A comprehensive presentation of these factors therefore seems unnecessary.
Trait: number of mountings (NM)
Model 3: all pairs of bucks
Mounting (NM) was recorded in 2.5 % of all 5 minute observation periods. This means, on average this presumed sexually stimulated behaviour could be observed in 1 of 40 observation periods (3h:20m), i.e. relatively seldom, even during the first hour of the lighting period, when the animals were intensely active.
Figure 4 shows how the frequency of mounting changes within the genetic groups with increasing age. Between genetic group and age there is a significant interaction (α < 0.01). Bucks of genetic groups 3 and 4 started with the mutual mounting almost 2 weeks earlier than genetic group 5. This observation indicates that animals of genetic group 5 reach sexual maturity later than genetic groups 3 and 4 under the same environmental conditions. There are obvious differences in age when the animals start with mounting and the frequency of it, yet there is no tendency concerning frequency and age.
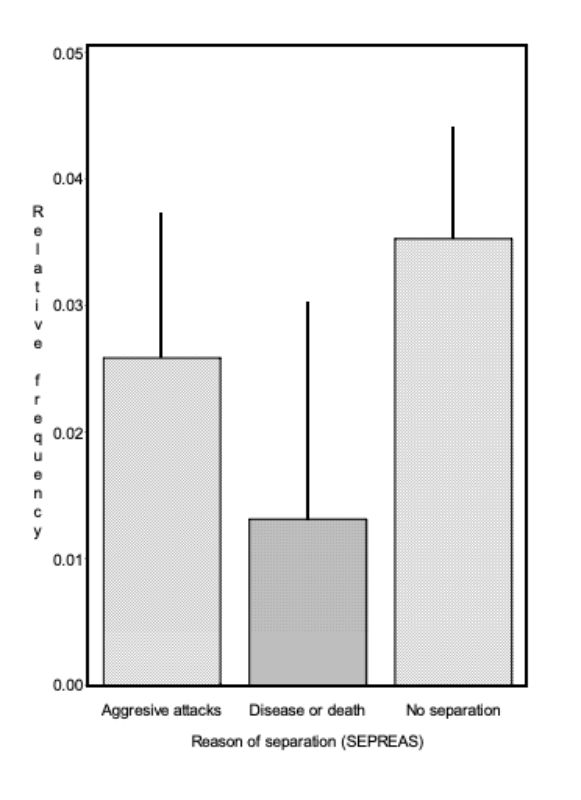
Figure 5 shows the relative frequency of observed mounting within those pairs of bucks which were separated later because of aggressive attacks, of illness or death or which stayed together until the end of the test. Although he differences between the 3 groups were not significant, (α > 0.08) there was a tendency. Regardless, the difference does not seem to be of practical importance because the pairs of bucks which could be kept together till the end of the test showed the highest frequency of observed mounting. Therefore these results do not indicate that aggressive attacks and sexual activity, observed here as mounting between animals of the same sex, correlate in an undesirable way.
Figure 4: Average relative frequency (BLUE – estimate and upper 0.95 confidence limit) of
mounting (NM) which had been observed within 3 genetic groups in the various
life weeks. The interaction between genetic group and life week was statistically
significant (α < 0.01).
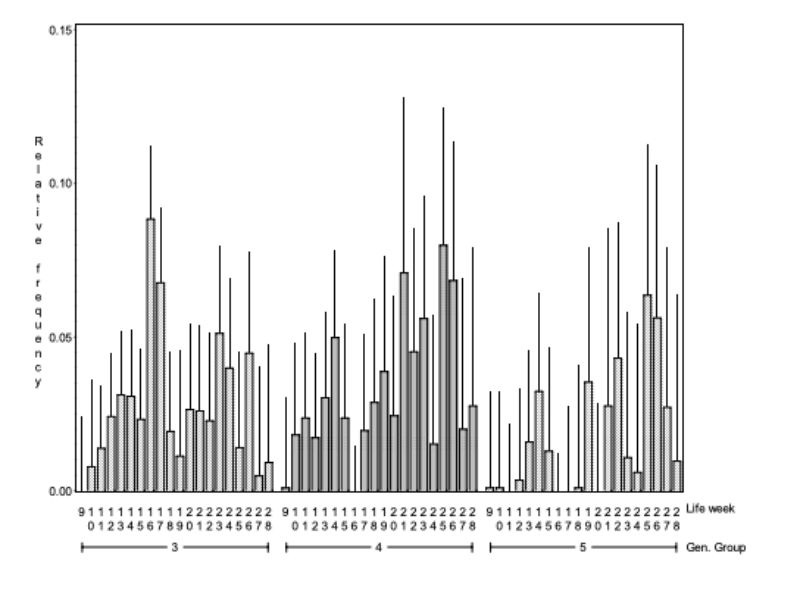
Figure 5: Average relative frequency
Model 4 – pairs of bucks which had to be separated because of aggression In order to investigate whether the frequency of mounting increases before the animals have to be separated because of aggression the trait NM was analysed with model 4 within these pairs of bucks. For the linear and quadratic term of the regression function on time of separation in weeks approached significance (α = 0.06 or 0.07).
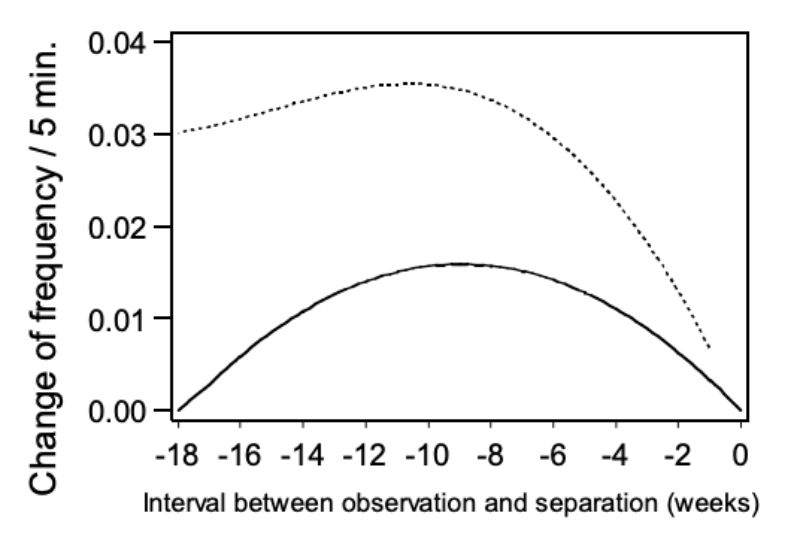
In Figure 6 the change in trait NM is presented as the within pair quadratic regression of aggressive attacks on the age period when separation became necessary. The points of the regression curve show the deviation of the week (0) in which the animals were separated. As expected the estimated values become less precise as the period of separation gets longer and the number of observations decreases. However, the data does not support the hypothesis, that incidence of mounting increases before aggressive attacks. The contrary seems to be the case. From the 1st to the 9th week before separation, the incidence of observed mounting between animals of the same age distinctly increased. The hypothesis that there is a causal connection between mounting and the occurrence of aggressive attacks is not supported by our data.
Figure 6: Change of frequency in mounting (NM) depending on the interval between the
observation and the time of separation. Regression curve and upper 0.95 confidence
limits.
Trait: number of chasings (NC)
Model 3: All pairs of bucks
Chasing (NC) was recorded in 4.5 % of all 5-minute observation periods. Thus the feature could be observed twice as often as mounting, but still relatively seldom. Figure 7 shows how the observed frequency of chasing changes with age. In this figure the pairs were grouped according to the reasons for their separation (SEPAREAS). The influence of age on NC was evident (α = 0.05). In Figure 7 it can be seen that chasing was observed less frequently during the first weeks, when this behaviour had a different quality and was not recorded as such. Early on, the pairs circulated very slowly, which cannot be described as actual chasing. Therefore it can be assumed that chasing as well as mounting starts with sexual maturity. After 14 weeks of age no definite development can be noticed.
The interaction between the reason for separation and age was significant (α< 0.01). To check whether these interactions manifest themselves in different trends, the regression of the presented averages was estimated separately for each group. The regression coefficients in the groups “separation because of aggressive attacks, death/disease and no separation at all” do not differ significantly. The observed interaction cannot be classified according to any of the causes, because of their irregular occurrence.
Figure 7: Average relative frequency (BLUE – estimate and upper 0.95 confidence limit) at
which chasing was observed (NC) in the various life weeks*) within the pairs which
had to separated because of various reasons. The interaction between reason for
separation and age was significant (α< 0.01).
*) No results for weeks 19 and 21 are given, because observations were incomplete around Christmas.
Model 4: Pairs of bucks separated because of aggressive attacks
Similar to mounting (NM), the trait chasing (NC) was analysed according to model 4 to determine whether it was observed more often in pairs separated because of aggressive attacks. Besides the effect of age (α = 0.01) the quadratic regression on the period of separation was significant (α<0.02). In Figure 8 the relation between NC and the period of separation is presented in weeks. Again the points on the regression curve show the deviation of one week (0) in which the pairs had been separated. As shown in the figure, chasing was observed most frequently in the week prior to separation suggesting a connection between chasing and occurrence of aggressive attacks.
Trait: number of chasings before separation (NCS)
Model 5: Pairs of bucks separated because of aggressive attacks
Using model 5, we could determine if NCS changed within the last six days for pairs which were separated because of aggressive attacks. In this model the quadratic regression was significant on the day before the separation took place (α < 0.01) and the regression function is presented in Figure 9.
Figure 8: Change of the frequency of chasing (NC) depending on the interval between the
observation and the separation: regression curve and upper and lower 0.95
confidence limits.
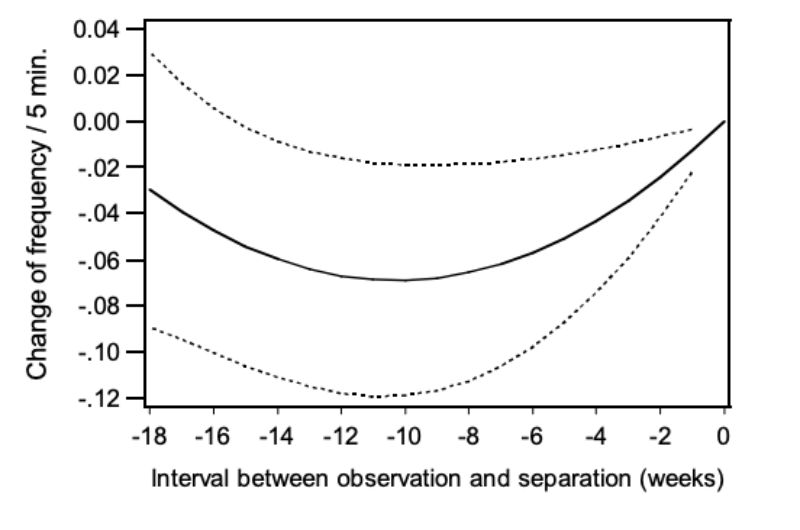
Figure 9: Change of the frequency of chasing (NC) during 5 days preceding the separation:
regression curve with upper and lower 0.95 confidence limits.
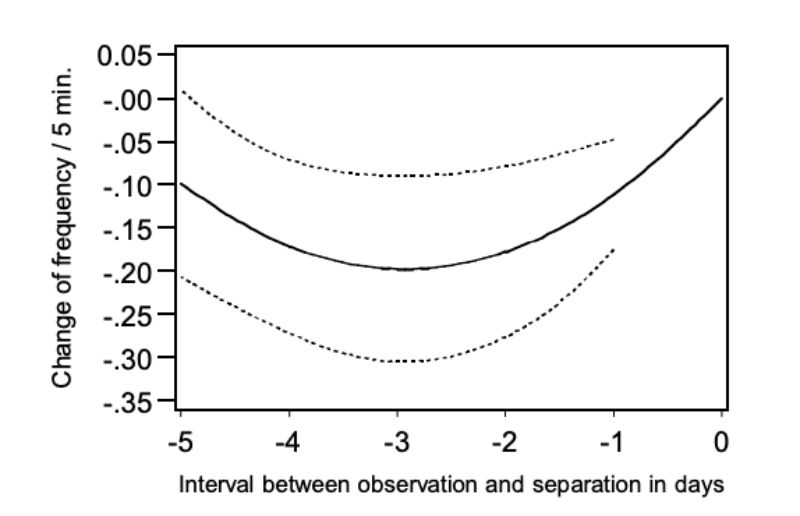
Analogous to Figures 7 and 8 the points of the regression function were presented as a deviation from day 0, this is the day when the pairs of bucks were separated. The figure shows that chasing was observed distinctly more frequently in the morning before the day of separation and in the morning of the separation day itself. From this observation a connection between chasing and the occurrence of aggressive attacks can be derived. As the occurrence of chasing was only observed within a 5-minute observation period for 20% of all pairs even in the morning of the day at which the animals
had to be separated, this trait does not lend itself for prediction of aggressive attacks with injuries. It should also be noted that chasing occurred only slightly less frequently in pairs which did not have to be separated. The question remains when and why the harmless chasing turns into aggressive attacks which may lead to injuries. There may be an ontogeny of behaviour where chasing is a “play behaviour” that occurs prior to aggressive behaviour.
Model 2: Differences within genetic groups
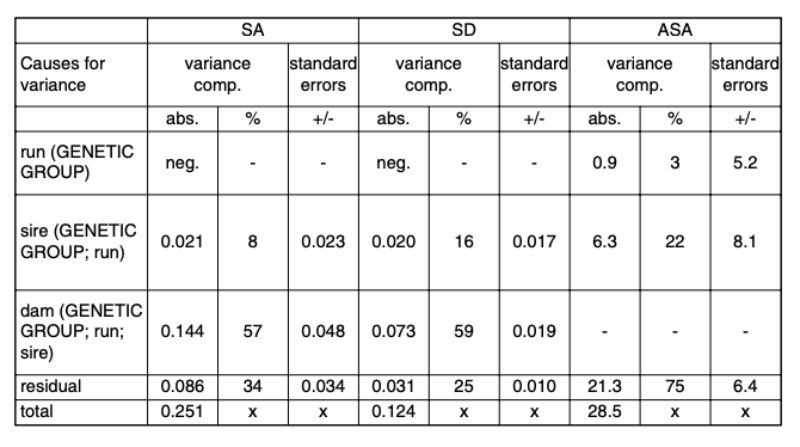
The estimates of variance components from model 2 are presented in Table 7. Negative estimates were interpreted as random deviations from 0 and were ignored in the further calculations.Table 7: Variance components in percentages and in absolute values for the random effects
and their standard errors. Traits: SA (separation because of aggressive attacks and
bite injuries); SD (separation of the animals because of disease or death); ASA (age
at separation because of attacks and bite injuries in days).
Variability between runs within genetic groups
In no trait were important differences found between the random samples of the same genetic groups. The test animals were kept during a period of 3 ½ years together. During such a long period, the breeding populations and/or the conditions of keeping may change. Yet these changes have not influenced the investigated traits compared to the overall variability, which confirms the general experience of rabbit keepers that injuries caused by aggressive attacks happen time and again in many different environments and in all rabbit breeds and lines when sexually mature bucks are kept in groups.
Estimates of heritability The heritability estimates are presented in Table 8. Across the investigated genetic groups, considerable genetic differences were found for all 3 traits. However, the heritability estimates had high standard errors due to the limited number of animals. Below we will suggest how a population average can be changed in the desired direction by selection, if the estimated h² are confirmed by a sufficient number of observations.
Table 8: Heritability estimates with standard errors.
Expected selection response
Trait: separation because of aggression (SA)
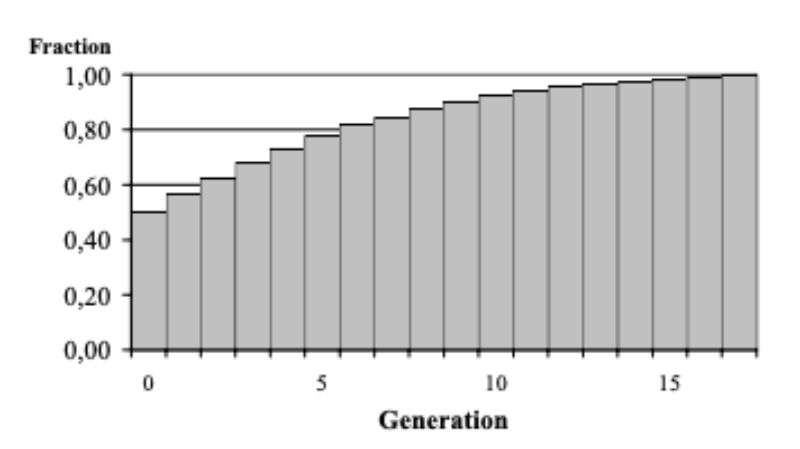
The response to selection is expected to decline as the fraction of aggressive bucks decreases from generation to generation (Figure 10). Under the circumstances assumed it seems possible, however, to develop within a foreseeable period of time populations which only rarely show injuries by aggressive attacks among bucks in the testing environment. Within 5 generations, the fraction of bucks not attacking their cage mates during the testing period is expected to increase from 50 to 77 %, within the following 5 generations even to 92 %. Assuming a generation interval of 1.5 years, it appears possible to develop a population with the desired low frequency of aggressive behaviour within 15 – 20 years.
If these improvements could be achieved under conditions of commercial rabbit fattening, attacks of bucks would become so infrequent in these lines that fattening could take place in larger groups, as demanded by animal welfare (Bigler and Oester, 1994), without excessive injuries.
Figure 10: Expected increase of the
fraction of “non-aggressive”
bucks if the population is
selected according to the
conditions discussed in the
text.
Trait age at separation because of aggression (ASA)
It does not seem to make much sense to consider for selection „Age at the Start of Biting”. In all populations the fraction of pairs not showing any aggressive attacks during the observation period was large enough to select only these for reproduction of the next generation. With the kind of observation applied until age of 30 weeks, the same pairs will be selected as if selection is based on trait SA.
Correlated Selection Effects
As there is no information available concerning genetic correlations with other traits, no statement can be made as to the effects of such a selection on conventional traits like fertility and fattening performance. The high fraction of bucks not showing any noticeable aggressive behaviour leads us to expect that correlations to conventional selection traits are not prohibitive. However, adding any additional trait to a selection program will slow down potential progress in all other traits.
Bigler L. and H. Oester (1994): Die Beurteilung der Tierartgerechtheit von Aufstallungssystemen für kleine und große Mastkaninchen-Gruppen. Berliner und Münchener Tierärztl. Wochenschrift. 103, 150-156.
Heil, G. (1997): Erbliche Einflüsse auf die Entwicklung des aggressiven Verhaltens von gemeinsam gehaltenen männlichen Hauskaninchen. Bericht der 10. Arbeitstagung über Haltung und Krankheiten der Kaninchen, Pelztiere und Heimtiere. Celle.
Heil, G. (2003): Erbliche Unterschiede im aggressiven Verhalten paarweise gehaltener männlicher Hauskaninchen im Alter von 8 – 30 Wochen. Bericht der 13. Arbeitstagung über Haltung und Krankheiten der Kaninchen, Pelztiere und Heimtiere. Celle.
Heil G. and L. Dempfle (2008): Erbliche Einflüsse auf die Entwicklung des aggressiven Verhaltens männlicher Hauskaninchen. Archiv für Geflügelkunde 72,188-192.
Koetter U. and H. Werner (1985): Selbstversorgen durch Kaninchenhaltung : Der Ratgeber für Aufzucht, Pflege, Nutzung. Pietsch, Stuttgart.
SAS Institute Inc., 1999 SAS OnlineDoc®, Version 8, Cary, NC: SAS Institute Inc. Starke, P. and F. Poppe (1917): Praktische Kaninchenzucht : Handbuch für Anfänger und erfahrene Züchter.10. Aufl. Leipzig.
Zusammenfassung
Wenn man männliche Hauskaninchen in Gruppen mästet, kommt es gegen Ende der Mast von 12 Wochen vereinzelt zu Bissverletzungen. Untersucht wurde die Bedeutung erblicher Einflüsse auf die Häufigkeit, mit der aggressives Verhalten zwischen Rammlern auftritt, sowie auf das Alter, in dem die Aggressionen beginnen. 193 Rammlerpaare, davon 142 mit bekannter elterlicher Abstammung, aus 5 verschiedenen genetischen Gruppen wurden unter gleichen Bedingungen gehalten. Als Versuchseinheit dienten 2 männliche Wurfgeschwister in einem herkömmlichen Mastkäfig.43 % aller Paare mussten wegen Bissverletzungen oder Angriffen getrennt werden. Die Unterschiede zwischen den genetischen Gruppen waren statistisch nicht signifikant und erscheinen auch im Hinblick auf ihre Größenordnung für die Kaninchenmast von geringer Bedeutung.
Die zur Trennung der Paare führenden Bissverletzungen und Angriffe traten bei allen genetischen Gruppen im gesamten Beobachtungszeitraum auf. Die genetischen Gruppen unterschieden sich statistisch signifikant im durchschnittlichen Alter, in dem eine Trennung wegen Aggressionen vorgenommen wurde. Diese Unterschiede scheinen allerdings ebenso wenig von praktischem Interesse wie die Unterschiede im Alter, in dem die erste Gruppe getrennt werden musste.
Im Durchschnitt aller genetischen Gruppen waren Gewichtsunterschiede zwischen dem Angreifer und dem Opfer weder beim Einstallen noch bei der Trennung statistisch signifikant. Auch zwischen den genetischen Gruppen gab es hinsichtlich dieser Merkmale keine signifikanten Unterschiede. Die Häufigkeit der Aufsprünge und die Trennung wegen Aggression waren nicht korreliert. Die genetischen Gruppen unterschieden sich hinsichtlich des Alters beim Beginn der Aufsprünge.
Das „Treiben“ war statistisch signifikant altersabhängig. Dieses Merkmal wurde in den ersten Wochen deutlich seltener beobachtet und hängt offenbar mit der Geschlechtsreife zusammen. Kurz vor der Trennung wegen Aggression wurde Treiben häufiger beobachtet. Dieses Verhalten ist aber zu selten und zu unregelmäßig, um es in der Kaninchenmast zur Vorbeuge gegen drohende Verletzungen nutzen zu können.
Im Durchschnitt der 5 genetischen Gruppen wurde für die Häufigkeit der Verletzungen eine mittlere Heritabilität von 0,32 geschätzt; für das Alter, bei dem die Verletzungen auftraten, war die geschätzte Heritabilität mit 0,92 erstaunlich hoch. Falls sich diese Werte innerhalb einer Linie bestätigen, bietet dies gute Voraussetzungen, um die Häufigkeit von Angriffen und Bissverletzungen durch gezielte Selektion zu verändern.