


Introduction
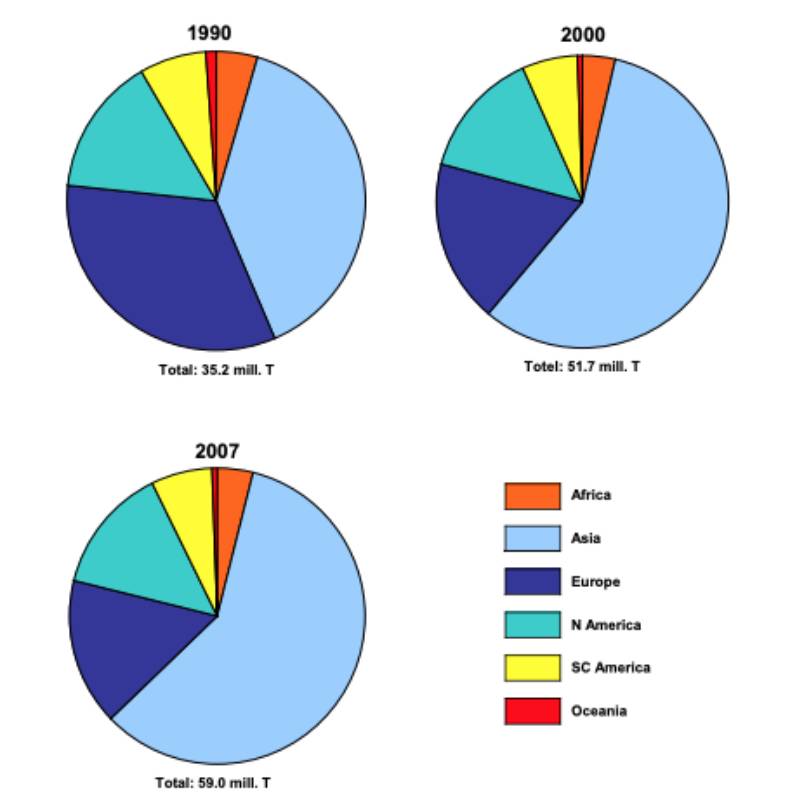
ITo comply with EU regulations, less than 15 months are left until the January 2012 deadline, at which time all conventional cages must be replaced by enriched cages or non-cage systems. While egg producers in some countries are still hoping for an extension of the transition period, the changes during the past two decades documented in this study suggest that there will be winners and losers, but probably no shortage of supply.World egg production increased from 35.2 million t in 1990 to almost 61 million t in 2008 or by 72.4 %. With a share of 58.8 % Asia dominated global production in 2008, whereas Europe lost almost half of its former contribution in the same time period (figure 1). The share of the EU member states fell from 17.8 % to 10.8 %. Nevertheless, European countries are in a leading position in global egg trade sharing almost two thirds of egg exports and of egg imports.
Figure 1: The changing contribution of the continents to global egg produduction in 1990,
2000 and 2007 (source: FAO database)
The dynamics in European egg production over the past two decades has been remarkable. The reason for the changes are on the one hand to be found in the political and socio-economic transformation processes in the former USSR and several Eastern European countries, not all of them were able to adapt to a market oriented economy within a short time, and on the other hand in the banning of conventional cages in the EU. Even though cages will be permitted until 2012, with the exception of Austria and Germany, the necessary transformation processes already begin to show impacts on egg production and trade.
The main goals of this paper are:
• to give an overview about the development of egg production in Europe between 1990 and 2008 on the basis of sub-regions,
• to identify countries with increasing, stagnating or decreasing egg production,
• to characterise the trade balance of the European sub-regions for shell eggs.
Development of egg production in the European sub-regions between 1990 and 2008
Between 1990 and 2008 European egg production decreased from 11.6 to less than 10 million t in 2008 (table 1). As can be seen from figure 2 the decrease was mainly a result of the new political and economic situation in Eastern Europe. The downward trend lasted until 1996, from then on most of these countries showed an increase in the production volume. In Western Europe, a decreasing egg production can be observed since 2001, a result of the development in France, Germany and the Netherlands. The steering factors behind this dynamics will be analysed in detail in a later chapter. Egg production in Northern and Southern Europe has been less fluctuating even though a decrease in the production volume can also be observed in some Southern European countries since 2004. This dynamics is also reflected in the contribution of the sub-regions to the overall egg production in Europe (figure 3).Figure 2: Development of egg production in the sub-regions of Europe between 1990 and
2007 (source: FAO database)
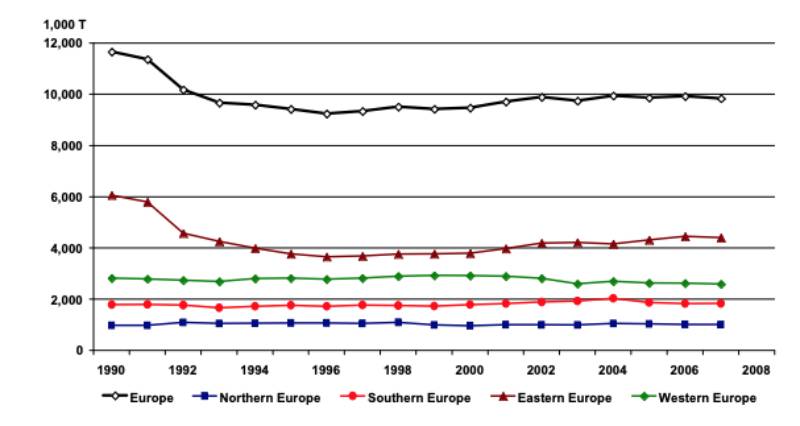
Table 1: The development of egg production in the European sub-regions between 1990
and 2008; data in 1,000 t (Source: FAO database)
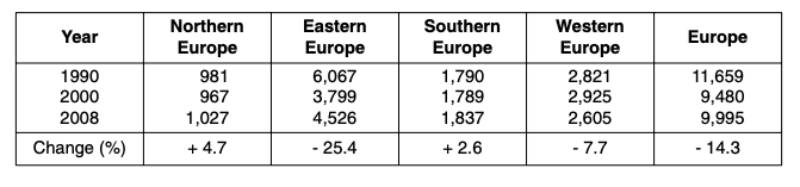
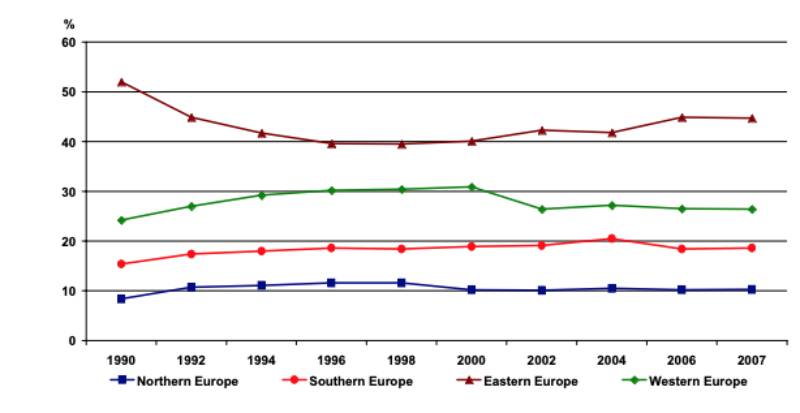
Figure 3: The changing contribution of the sub-regions to Europaen egg produduction
between 1990 and 2007 (source: FAO database)
Eastern Europe
Eastern European countries contributed 52.0 % to European egg production in 1990 (see figure 3). Because of the political and socio-economic transformation processes the production volume decreased rapidly in many countries in the subsequent years. As can be seen from figure 4, the adaption process to the new economic situation lasted several years and differed from country to country. In Poland, an upward trend can be observed as early as 1994, in Romania not before 2000. The egg industry in Hungary has not been able so far to stop the downward trend. A short period with an increasing production volume at the beginning of the decade was followed by another phase with decreasing production. In Bulgaria, the situation has been stabilising but the production volume is still lower than in 1990.Figure 4: Development of egg production in Poland, Romania, Hungary and Bulgaria between
1990 and 2007 (Source: FAO database)
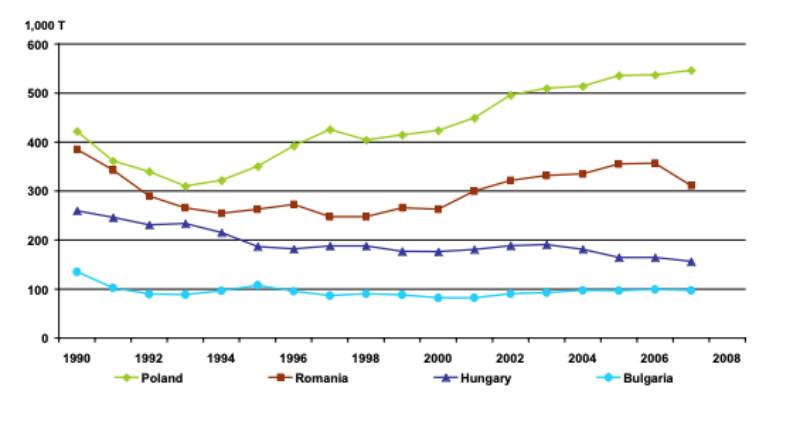
Table 2: The ranking of the Eastern European countries in egg production in 2008
(Source: FAO database)

The figures in table 2 show that the Russian Federation has a dominating position as egg producer in 2008 with a share of 46.8 %, followed by the Ukraine and Poland. Between 1993 and 2008, egg production in Poland increased by more than 270,000 t, in the Ukraine by almost 190,000 t and in Romania by 68,000 t. In contrast, the production volume in Russia was still 120,000 t lower than in 1993 and in Hungary 75,000 t. Obviously, the contrasting development had also an impact on European egg trade, for some countries have been able to become major egg exporting countries, for example Poland. The regional concentration in Eastern Europe is very high, a result of the dominating position of the Russian Federation. The three leading countries contributed 78.6 % to the overall egg production of this sub-region.
Western Europe
In 1990, Western European countries shared 24.2 % of the European egg production (figure 3). Because of the decrease of the production volume in Eastern Europe in the early 1990s, Western European countries could expand their contribution to 30.9 % in 2000. From then on a downward trend can be observed, on the one hand a result of the decreasing production volume in several countries and on the other of the recovery of the egg industry in a number of Eastern European countries. Egg production in 2008 was 216,000 t lower than in 1990 (table 1).A closer look at the development in selected countries shows the remarkable dynamics (figure 5). In France, egg production increased considerably between 1990 and 1999 before it started to decrease continuously. This reflects the general crisis of the French poultry industry for a similar dynamics can be observed in the poultry meat sector (Herczeg 2010). The low competitiveness of the French poultry farmers, which becomes obvious in decreasing exports and increasing imports, seems to be the main steering factor. Because of the high labour costs and very often only small flock sizes, the production costs are considerably higher than in the countries with which they have to compete.
A significant decrease of egg production occurred in Germany in the early 1990s, a result of the collapse of many large state farms in the former German Democratic Republic. The situation stabilised between 1993 and 2000, from then on, however, a continuous shrinking of the production volume can be observed. The latter is mainly due to the banning of conventional cages three years earlier than in most of the other EU member countries. A second decrease happened in 2009 when all conventional cages had to be abandoned. The self sufficiency rate fell to 55.8 % and the import volume of shell eggs for consumption was as high as 7 billion eggs (Windhorst 2009). Between 1990 and 2002 Dutch egg production hovered around 600,000 t. The Avian Influenza outbreak in 2003 led to a sharp decrease. Even though the egg industry has been recovering from this blow, the production volume is still lower than in 2000 (Windhorst 2010a). Egg production in Belgium has been fairly stable over the whole time period.
Figure 5: Development of egg production in France, Germany, the Netherlands, BelgiumLuxenbourg and Belgium between 1990 and 2007 (source: FAO database)
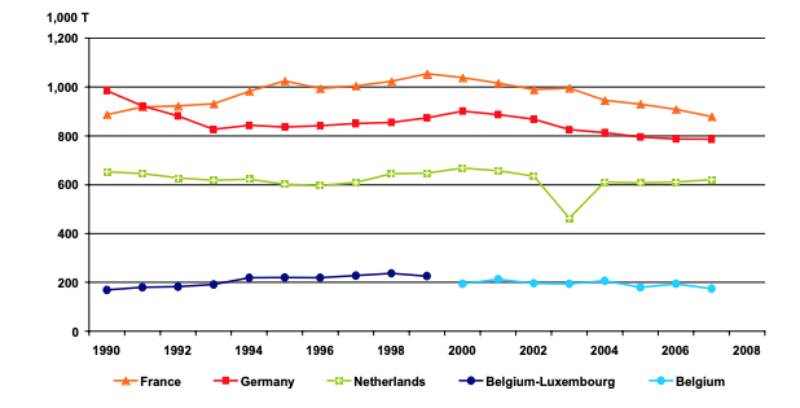
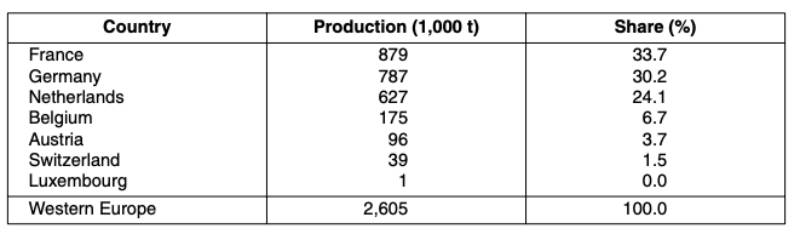
A closer look at the contribution of the Western European countries to the egg production volume of this sub-region and their ranking (table 3) reveals that in spite of a decreasing production France, Germany and the Netherlands dominated egg production. In 2008, they shared 88 % of the production volume of this sub-region. All other countries were of minor importance. This is in particular true for Luxembourg, Austria and Switzerland. The two latter have become major egg importing countries over the past years.
Table 3: The ranking of the Western European countries in egg production in 2008
(Source: FAO database)
Southern Europe
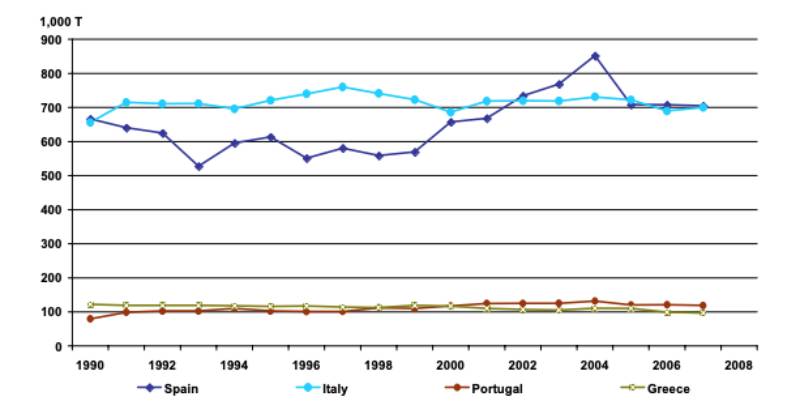
Southern European countries shared 18.4 % of the European egg production in 2008, 3 % more than in 1990 but 2.3 % less than in 2004. The downward trend is mainly a result of the dynamics in Spain and Italy.Italian egg production reached a peak in 1997 (figure 6). In the following years the production volume differed considerably from one year to the other, resulting from various Avian Influenza outbreaks in northern Italy. Since 2006 the production volume has been hovering around 700,000 t. The Spanish egg industry has shown a remarkable dynamics over the past ten years (Windhorst 2010b). Between 1999 and 2004, egg production increased by almost 200,000 t. The main steering factors behind this dynamics were a fast growing per capita consumption and growing exports. When The Netherlands had to reduce their exports because of the Avian Influenza outbreak, new markets for Spanish egg producers opened in Germany, France and the United Kingdom. With the recovery of the Dutch egg industry and the new role of Poland as a major egg exporting country, the Spanish egg industry lost important markets. Rising production costs because of higher feed costs, the devaluation of the English pound, high investment costs to control Salmonella infections in layer flocks as well as a reduction of per capita consumption because of high egg prices were the main steering factors behind the reduction of egg production and shell egg exports. In 2009 a considerable number of hen houses were left empty. Since 2005 egg production has been fairly stable at about 700,000 t, for 2009 a further decrease has been projected, however. Egg production in Portugal and Greece is considerably lower than in Spain and Italy; in Portugal a slight increase of the production volume can be observed.
Figure 6: Development of egg production in Spain, Italy Portugal and Greece between 1990
and 2007 (source: FAO database)
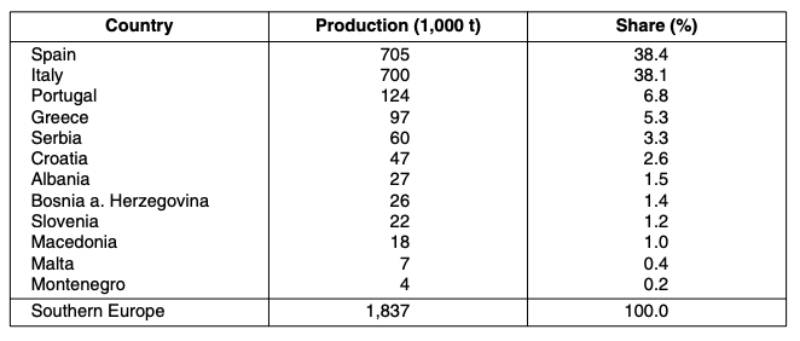
As can be seen from the data in table 4, Spain and Italy shared 76.5 % of the production volume of this sub-region. Egg production in all other countries was much lower. It is worth noting that Albania more than doubled its production since 1990.
Table 4: The ranking of the Southern European countries in egg production in 2008
(Source: FAO database)
Northern Europe
With a production volume of slightly over 1 million t the Northern European countries contributed 10.3 % to European egg production in 2008. From figure 7 one can see that egg production has not changed very much in the analysed time period in Denmark, Finland and Norway. In contrast, the production volume of the United Kingdom has been fluctuating considerably after 1998 when a peak was reached. This dynamics is closely related to the decision of several food retailers to no longer list eggs from cage production. Farmers who were not willing to invest in alternative forms of keeping laying hens quit production. On the other hand, several new free range farms, some of them with remarkable size, and farms with so called colony nests (a form of enriched cage) were built. Even though free range eggs are preferred by British consumers, eggs from colony nests gained market shares over the past years.Figure 7: Development of egg production in the United Kingdom, Denmark, Finland and
Norway between 1990 and 2007 (source: FAO database)
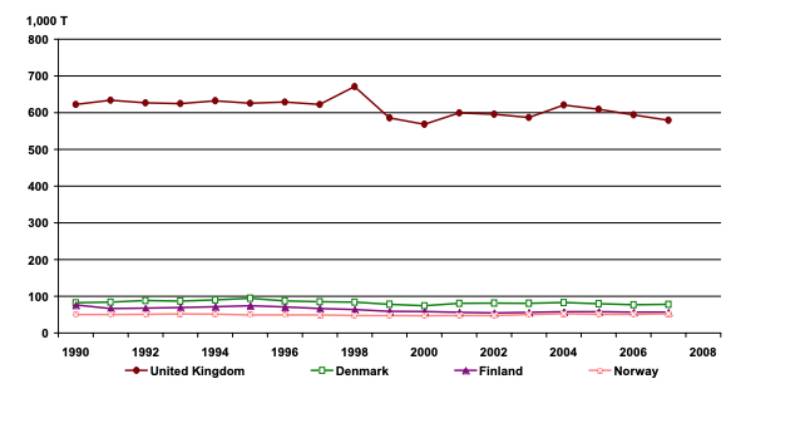
Table 5: The ranking of the Northern European countries in egg production in 2008
(Source: FAO database)
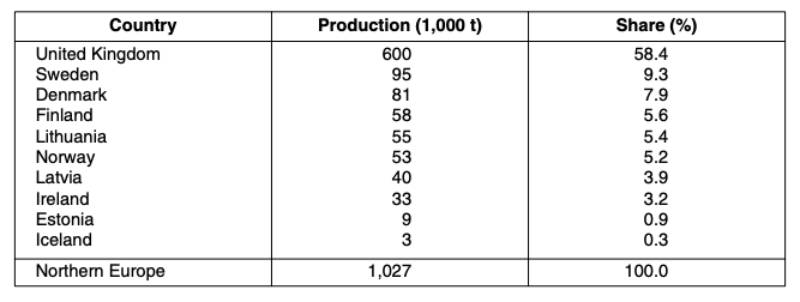
Table 6: The top ten countries in European egg production in 2008 (Source: FAO database)
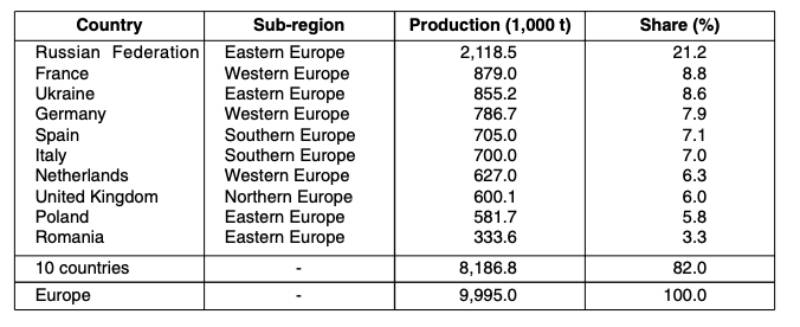
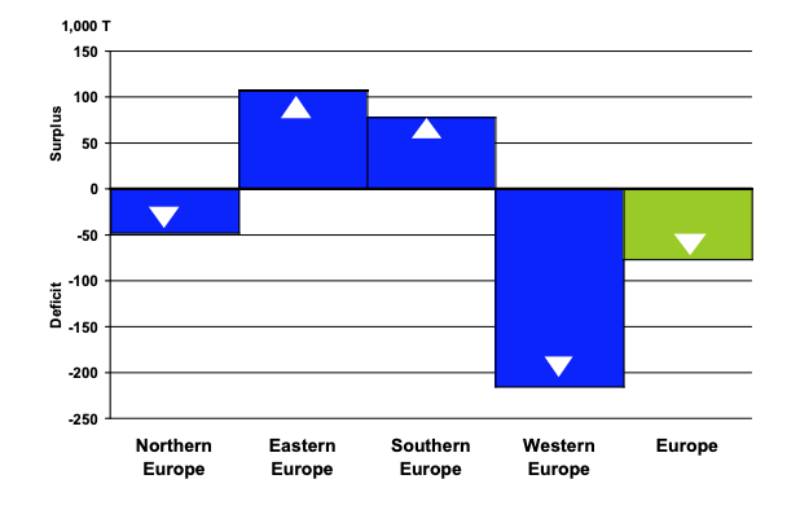
Figure 8: Trade balance for shell eggs in the sub-regions of Europe in 2007
(Source: Own calculations)
With a share of 58.4 %, the United Kingdom was the dominating egg producing country in this subregion. It was followed by Sweden, Denmark and Finland. Together they contributed 22.8 % to the overall production volume of this sub-region. While Latvia and Lithuania could expand their egg production since 1990, it is still decreasing in Estonia.
High regional concentration and negative trade balance
In 2008, the top 10 countries accounted for 82 % of the egg production in Europe (table 6). With a share of 21.2 % Russia was in a leading position. Four of the top ranked countries were located in Eastern Europe, three in Western Europe, two in Southern Europe and only one in Northern Europe.In 2007, the European trade balance with shell eggs for consumption was negative (figure 8). About 76,000 t of eggs had to be imported to meet the demand. The highest negative balance showed Western Europe with 215,000 t, the highest positive balance Eastern Europe with 108,000 t. It can be expected that the negative balance will increase over the next years because of the banning of cages in the EU from 2012 on and the necessary transformation process to alternative forms of keeping laying hens.
Main results
The main results of the analysis can be summarised as follows:
• The dynamics of egg production in the four European sub-regions differed considerably between 1990 and 2008.
• In Eastern Europe, the production volume decreased in Russia, Hungary and the Czech Republic whereas it increased in Poland.
• In Western Europe, production decreased in France, Germany and The Netherlands. In all other countries the production volume did not change very much.
• In Southern Europe, egg production increased in Spain (until 2004), Portugal and Albania whereas Greece and Italy had to face a downward trend.
• In Northern Europe, only the United Kingdom showed a considerable dynamics, mainly a result of the decision of food retailers to no longer list cage eggs.
• The regional concentration in European egg production is quite high. In 2008, 82 % of the overall production was concentrated in the ten leading countries, 30 % in the top two ranked countries.
• In 2007, the European trade balance with shell eggs for consumption was negative by 76,000 t.
FAO database: http://faostat.fao.org
Herczeg, V. 2010: French poultry market under strain. Poultry International (2) 11-12.
Windhorst, H.-W. (2009): Anhaltende Eierverknappung zeichnet sich ab. Deutsche Geflügelwirtschaft und Schweineproduktion 61 (43) 3-5.
Windhorst, H.-W. (2010a): Like Phoenix from the ashes. The recovery of the Dutch egg industry. Zootecnica 32 (1) 36-42.
Windhorst, H.-W. (2010b): The extraordinary recent dynamics of the Spanish egg industry. Zootecnica 31 (11), 12-22.
Zusammenfassung
Muster und Dynamik regionaler Verschiebungen der Eierproduktion in Teilregionen Europas Die europäischen Teilregionen wiesen im Zeitraum von 1990 bis 2008 bezüglich der Entwicklung der Eierproduktion eine sehr unterschiedliche Dynamik auf. In Osteuropa nahm die Erzeugung in Russland, Ungarn und der Tschechischen Republik deutlich ab, während es in Polen zu einem schnellen Anstieg kam.In Westeuropa verringerte sich das Produktionsvolumen in Deutschland, Frankreich und den Niederlanden. In den übrigen Ländern erfolgten keine stärkeren Veränderungen. In Südeuropa kam es ähnlich wie in Osteuropa zu gegenläufigen Entwicklungen. Während in Spanien (bis 2004), Portugal und Albanien die Eiererzeugung ausgeweitet wurde, ging sie in Italien und Griechenland zurück. Die Ursachen sind zum einen im Ausbruch der Aviären Influenza zum anderen in anhaltenden ökonomischen Problemen zu sehen. In Nordeuropa traten insgesamt nur geringe Veränderungen auf, nur im Vereinigten Königreich kam es ab 1998 zu einer stärkeren Dynamik, die ausgelöst wurde durch eine Umstellung auf Boden- und Freilandhaltung im Gefolge der Entscheidung des Lebensmitteleinzelhandels, keine Eier aus Käfighaltungen mehr zu listen. Die regionale Konzentration in der europäischen Eierproduktion ist sehr hoch. Auf die zehn führenden Staaten entfielen 2008 82,0 % der Gesamterzeugung, auf die beiden führenden Staaten Russland und Frankreich allein 30 %. Europa wies 2007 ein Defizit im Handel mit Schaleneiern zum Verzehr von 76.000 t auf. Mittelfristig ist mit einem deutlichen Anstieg der negativen Handelsbilanz zu rechnen, weil das Verbot der Käfighaltung ab 2012 in allen Mitgliedsländern der EU zumindest für einige Jahre zu einer deutlichen Verringerung des Produktionsvolumens führen wird.